New
Blue Triangle is now accessible via MCP. See how AI assistants can pull dollar-figured answers straight from your data.
Read the announcement →
Why Blue Triangle

Your customers' behavior. Your revenue priorities.

Blue Triangle collects experience measurements from your site and connects them to conversion and revenue from the same visits. That history helps your team decide where to focus and assess what changed afterward.
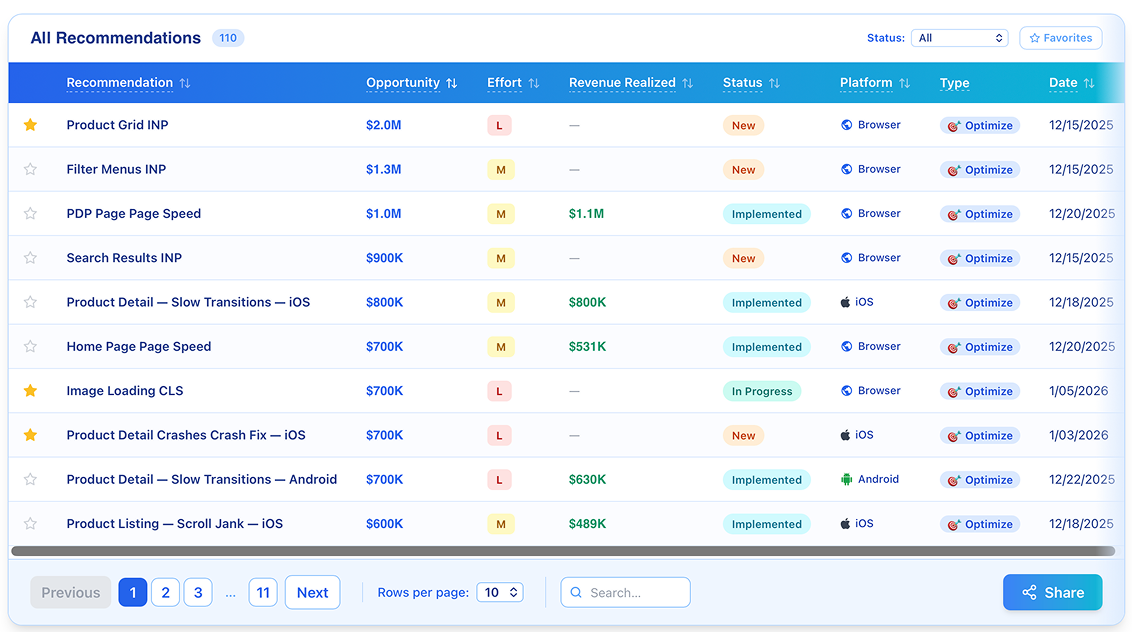
Blue Triangle recommendations ranked by estimated revenue opportunity

Dashboards can look healthy while conversion stays at risk.

Your team may already have performance scores and customer-experience reports. Blue Triangle connects experience measurements to conversion and revenue so you can decide which problems deserve attention first.

Prioritization by gut feel

Without a clear measure of friction impact, every backlog debate becomes opinion vs. opinion — the loudest voice wins, not the highest-impact fix.

From symptoms to investigation

Use performance and journey details to investigate a priority and give your team evidence for the next step.

Silent revenue leak

Slow pages and difficult journeys can put conversions at risk. Use your own customers' behavior to identify where to investigate.

The Conversion Rate Curve.

Blue Triangle's tag collects experience measurements from your site and connects them to conversion and revenue from the same visits. Our Conversion Rate Curve compares how your customers convert on slower and faster loads of the same page on the same device. Your own history drives the estimate, not an industry average.

During onboarding, we compare collected results with your analytics so your team can confirm a sensible starting point. Some pages show a strong link between speed and revenue and others don't. The result is an opportunity estimate to help rank improvements, not a guaranteed return. Traffic mix, buyer intent and other business factors still matter.

How the conversion rate curve report works

Before and after a change

Compare results before and after a change.

Overlay the before and after views to see how the experience shifted between two periods. Use that view alongside your measured results to assess the change and choose where to focus next.
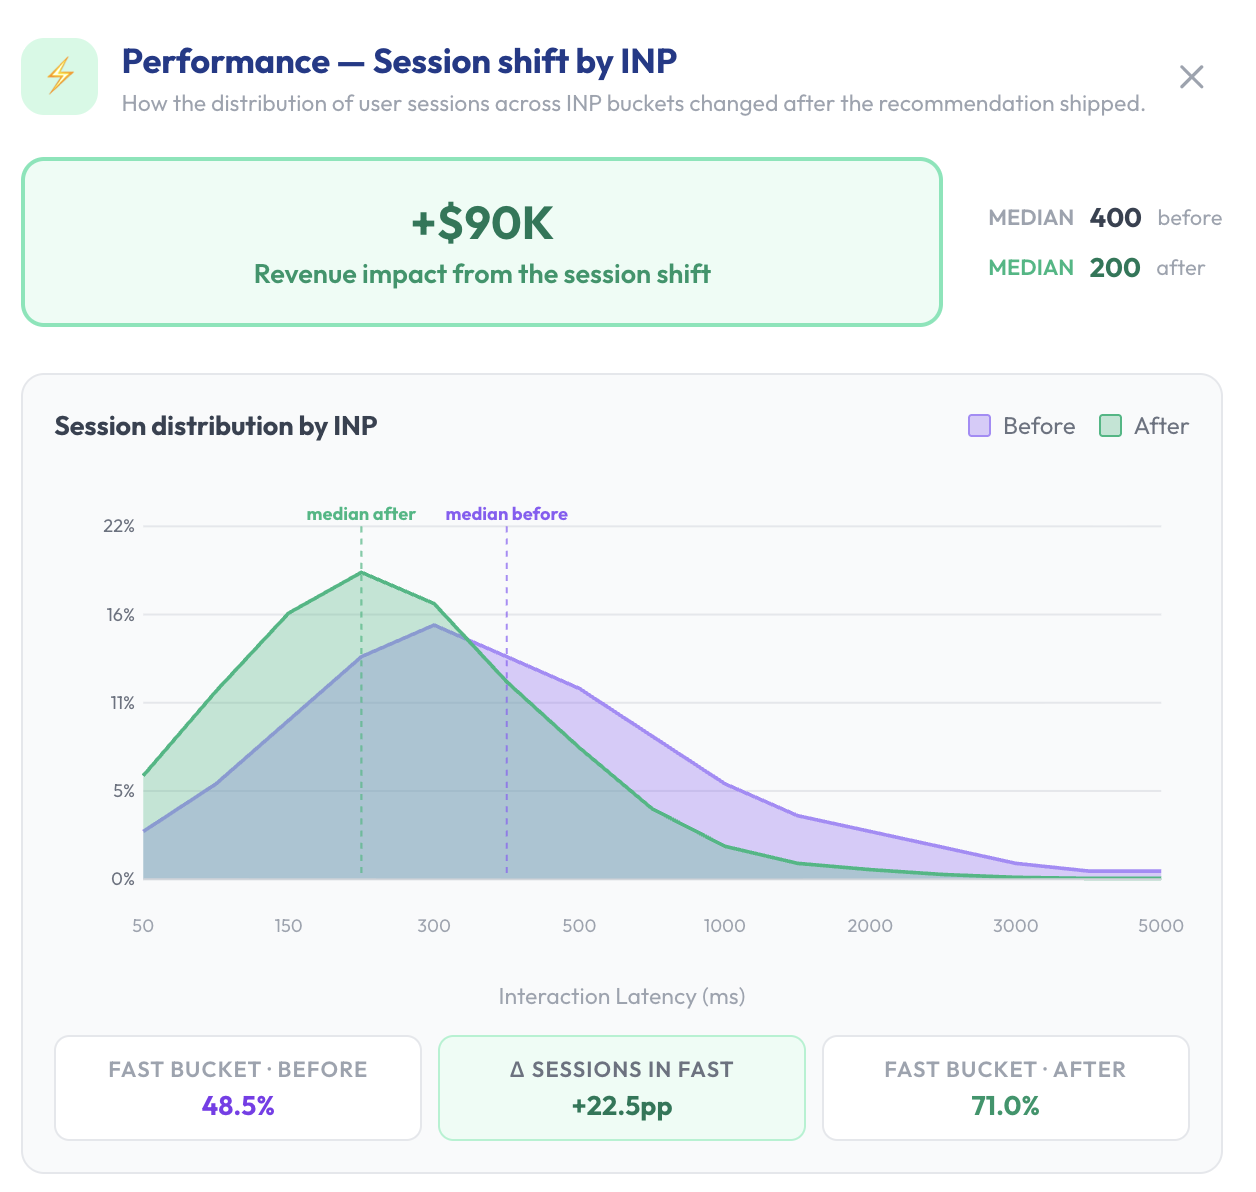
Before and after overlay showing sessions in the fast group rising from 48.5 percent to 71.0 percent after a change.

A closed loop that starts and ends with revenue.

Quantify. Prioritize & Resolve. Validate.

01
Quantify
Estimate opportunity before your team makes a change.

Before your team makes a change, Blue Triangle estimates page-level revenue opportunity using measured experience and conversion patterns from your own customers.

02
Prioritize
Turn findings into work your team can review.

Recommendations bring together revenue priorities, performance evidence and proposed user stories so your team can investigate causes and plan improvements.

03
Validate
Assess what changed afterward.

After your team makes a change, Blue Triangle helps assess its estimated contribution to revenue, alongside traffic and order-value changes. Promotions and seasonality cannot always be separated.

The loop never stops. Assessed results help inform the next round of priorities.

Coverage across the customer journey.

Capabilities and foundations that connect experience measurements to business priorities.

Revenue opportunity by page

Estimate where faster pages could create revenue opportunity, then rank pages for investigation.

Core Web Vitals + VitalScope™

Investigate loading, responsiveness and layout problems, and compare performance with competitors.

Customer journey analytics

Explore measured customer journeys and investigate where visits fail to convert.

Tag governance & CSP

Inventory and block unauthorized third-party scripts that are slowing your site, opening compliance exposure, and damaging consumer trust.

Broken links & OOS recovery

Investigate broken links and out-of-stocks that interrupt customer journeys. Identify pages with a higher likelihood of converting to guide recovery.

A decade of enterprise know-how, built in

Ten years of customer requirements have shaped how we collect, process, store and deliver data across websites and apps. Copying a screen doesn't recreate the engineering and enterprise experience behind it.

Measurement history your assistant can use

An AI assistant can explain an answer. Blue Triangle supplies the measurements, keeps the customer history and runs the revenue analysis behind it. Your assistant makes that foundation easier to use.

Numbers our competitors can't show you.

$6.8B

Uncovered in 12 months In lost revenue identified for leading online and omnichannel brands.

$60–80

Revenue recaptured per dollar Average revenue recaptured for every dollar invested in the platform.

I have a thousand problems on my eCommerce website. I only care about the problems costing us money.

Top 10 U.S. Retailer
Go Beyond Behavioral Signals

Connect experience findings to revenue priorities.

Experience analytics helps teams investigate customer behavior. Blue Triangle adds customer-specific revenue-opportunity estimates and tools to assess results after changes. Both can inform where your team focuses.

Behavioral analytics
Behavior and experience signals
Investigation of customer journeys
Context for customer experience
Priorities based on supported experience measures
Findings about what happened
Blue Triangle
Estimated revenue opportunity
Customer-specific experience and conversion history
Evidence for business prioritization
Priorities ranked by estimated dollar impact
Assessment after changes

One shared view of experience and revenue priorities.

Blue Triangle doesn't just give your engineers a new dashboard. It gives engineering, marketing, product and leadership a shared view of experience, conversion and estimated revenue opportunity, so teams can agree on where to focus first.

Engineering

Prioritize investigations using revenue opportunity, performance details and recommended next steps.

Marketing

Connect experience and conversion trends to revenue discussions and investigate friction on campaign pages.

Product

Use customer behavior and estimated revenue opportunity to inform roadmap priorities.

Leadership

Review estimated opportunities and post-change results alongside other business factors.

Customer Net Promoter Score: +83

2026 customer survey

Can we try it before buying?

Yes. Request a free Friction Quantified Analysis. It's a personalized report that estimates where friction costs your site revenue, page by page, with recommendations your team can act on with or without us. There's no obligation, and you don't need to sign up for Blue Triangle to get it. For greater accuracy, qualifying sites receive at least one million page views per month, and the site needs transactions with a revenue or business impact. Retail and non-retail sites can both qualify.

Get your free Friction Quantified Analysis

Ready to see where to focus?

See how your measured experience and conversion history can help identify revenue priorities.