.svg)
Most platforms tell you something's wrong. We tell you what it's worth — and prove you fixed it.
Experience analytics tools measure how customers feel — frustration scores, struggle metrics, engagement signals. None of them can answer the only question that matters: how much revenue is this costing me right now?
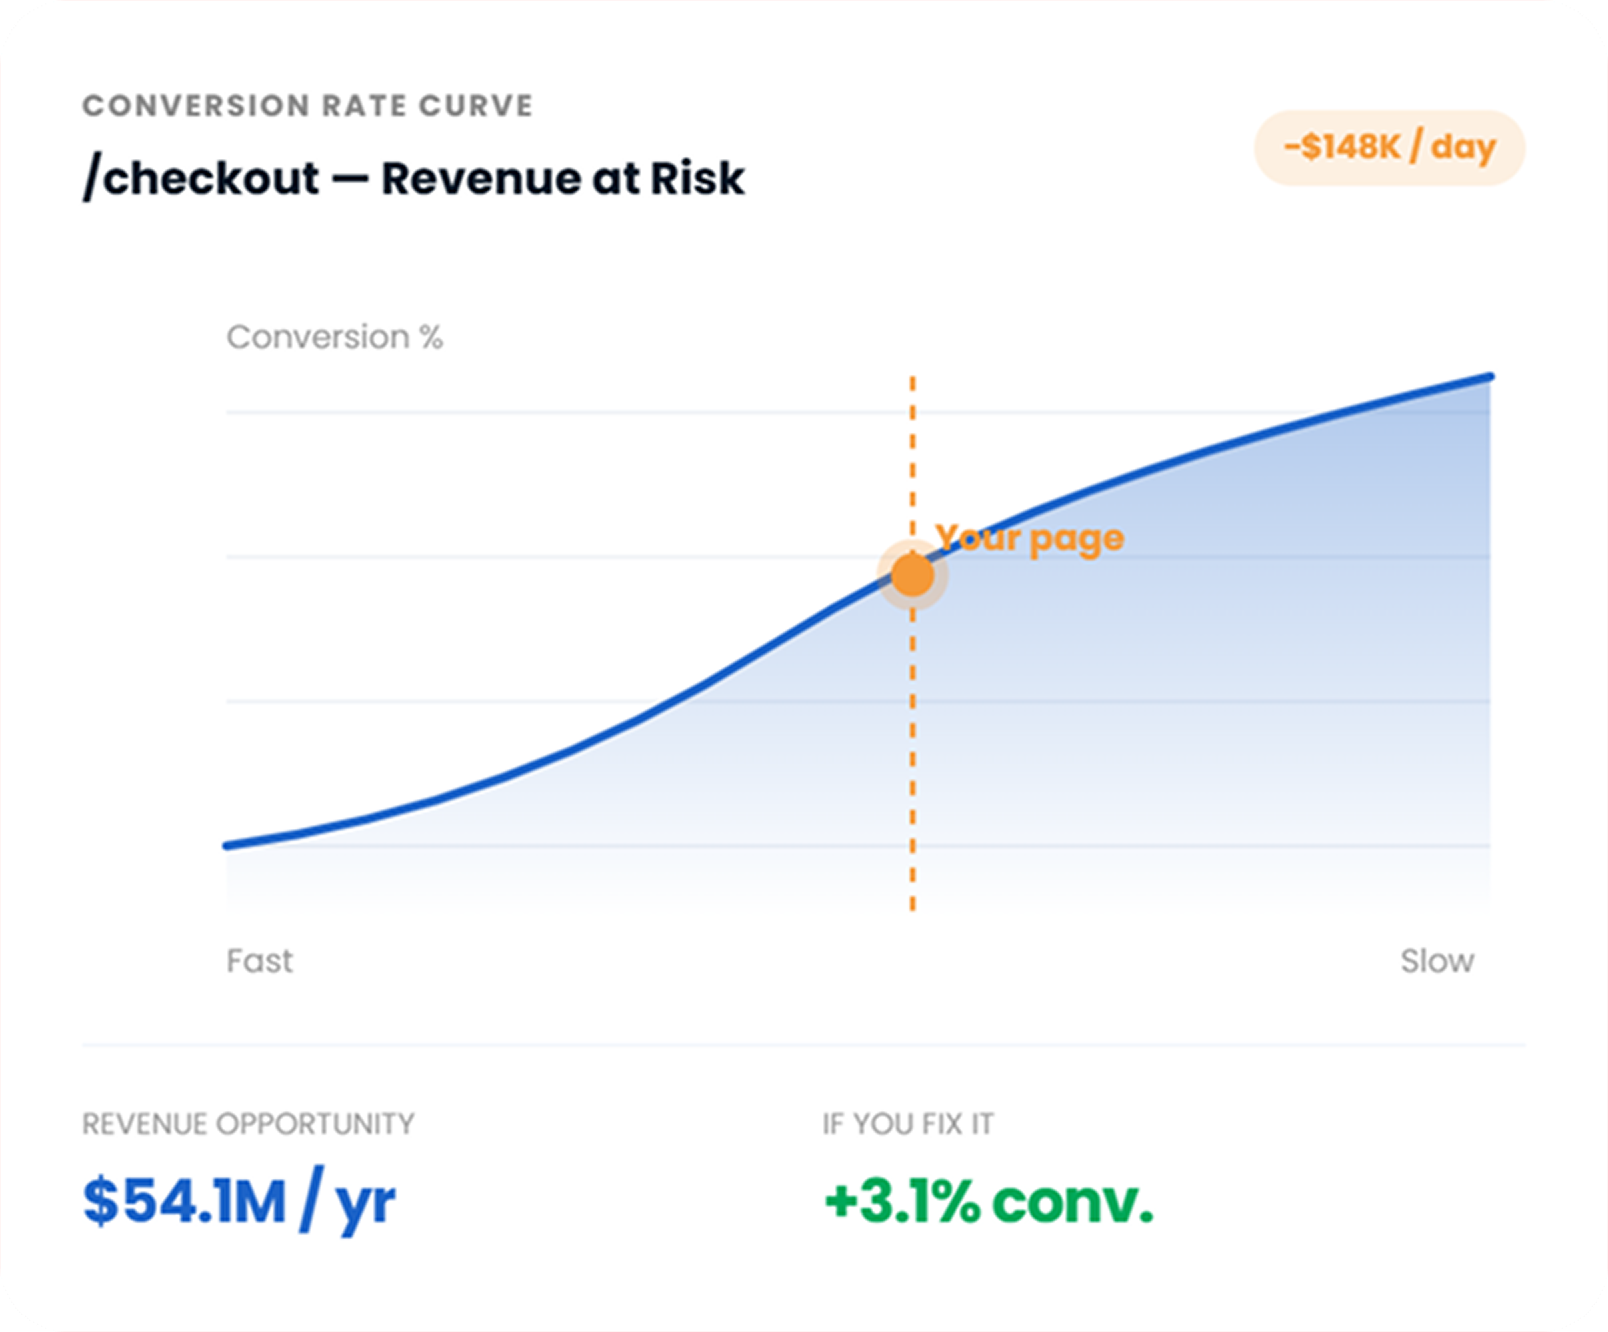
The Conversion Rate Curve.
At the heart of Blue Triangle is something no other platform has — our proprietary Conversion Rate Curve (CRC) methodology.
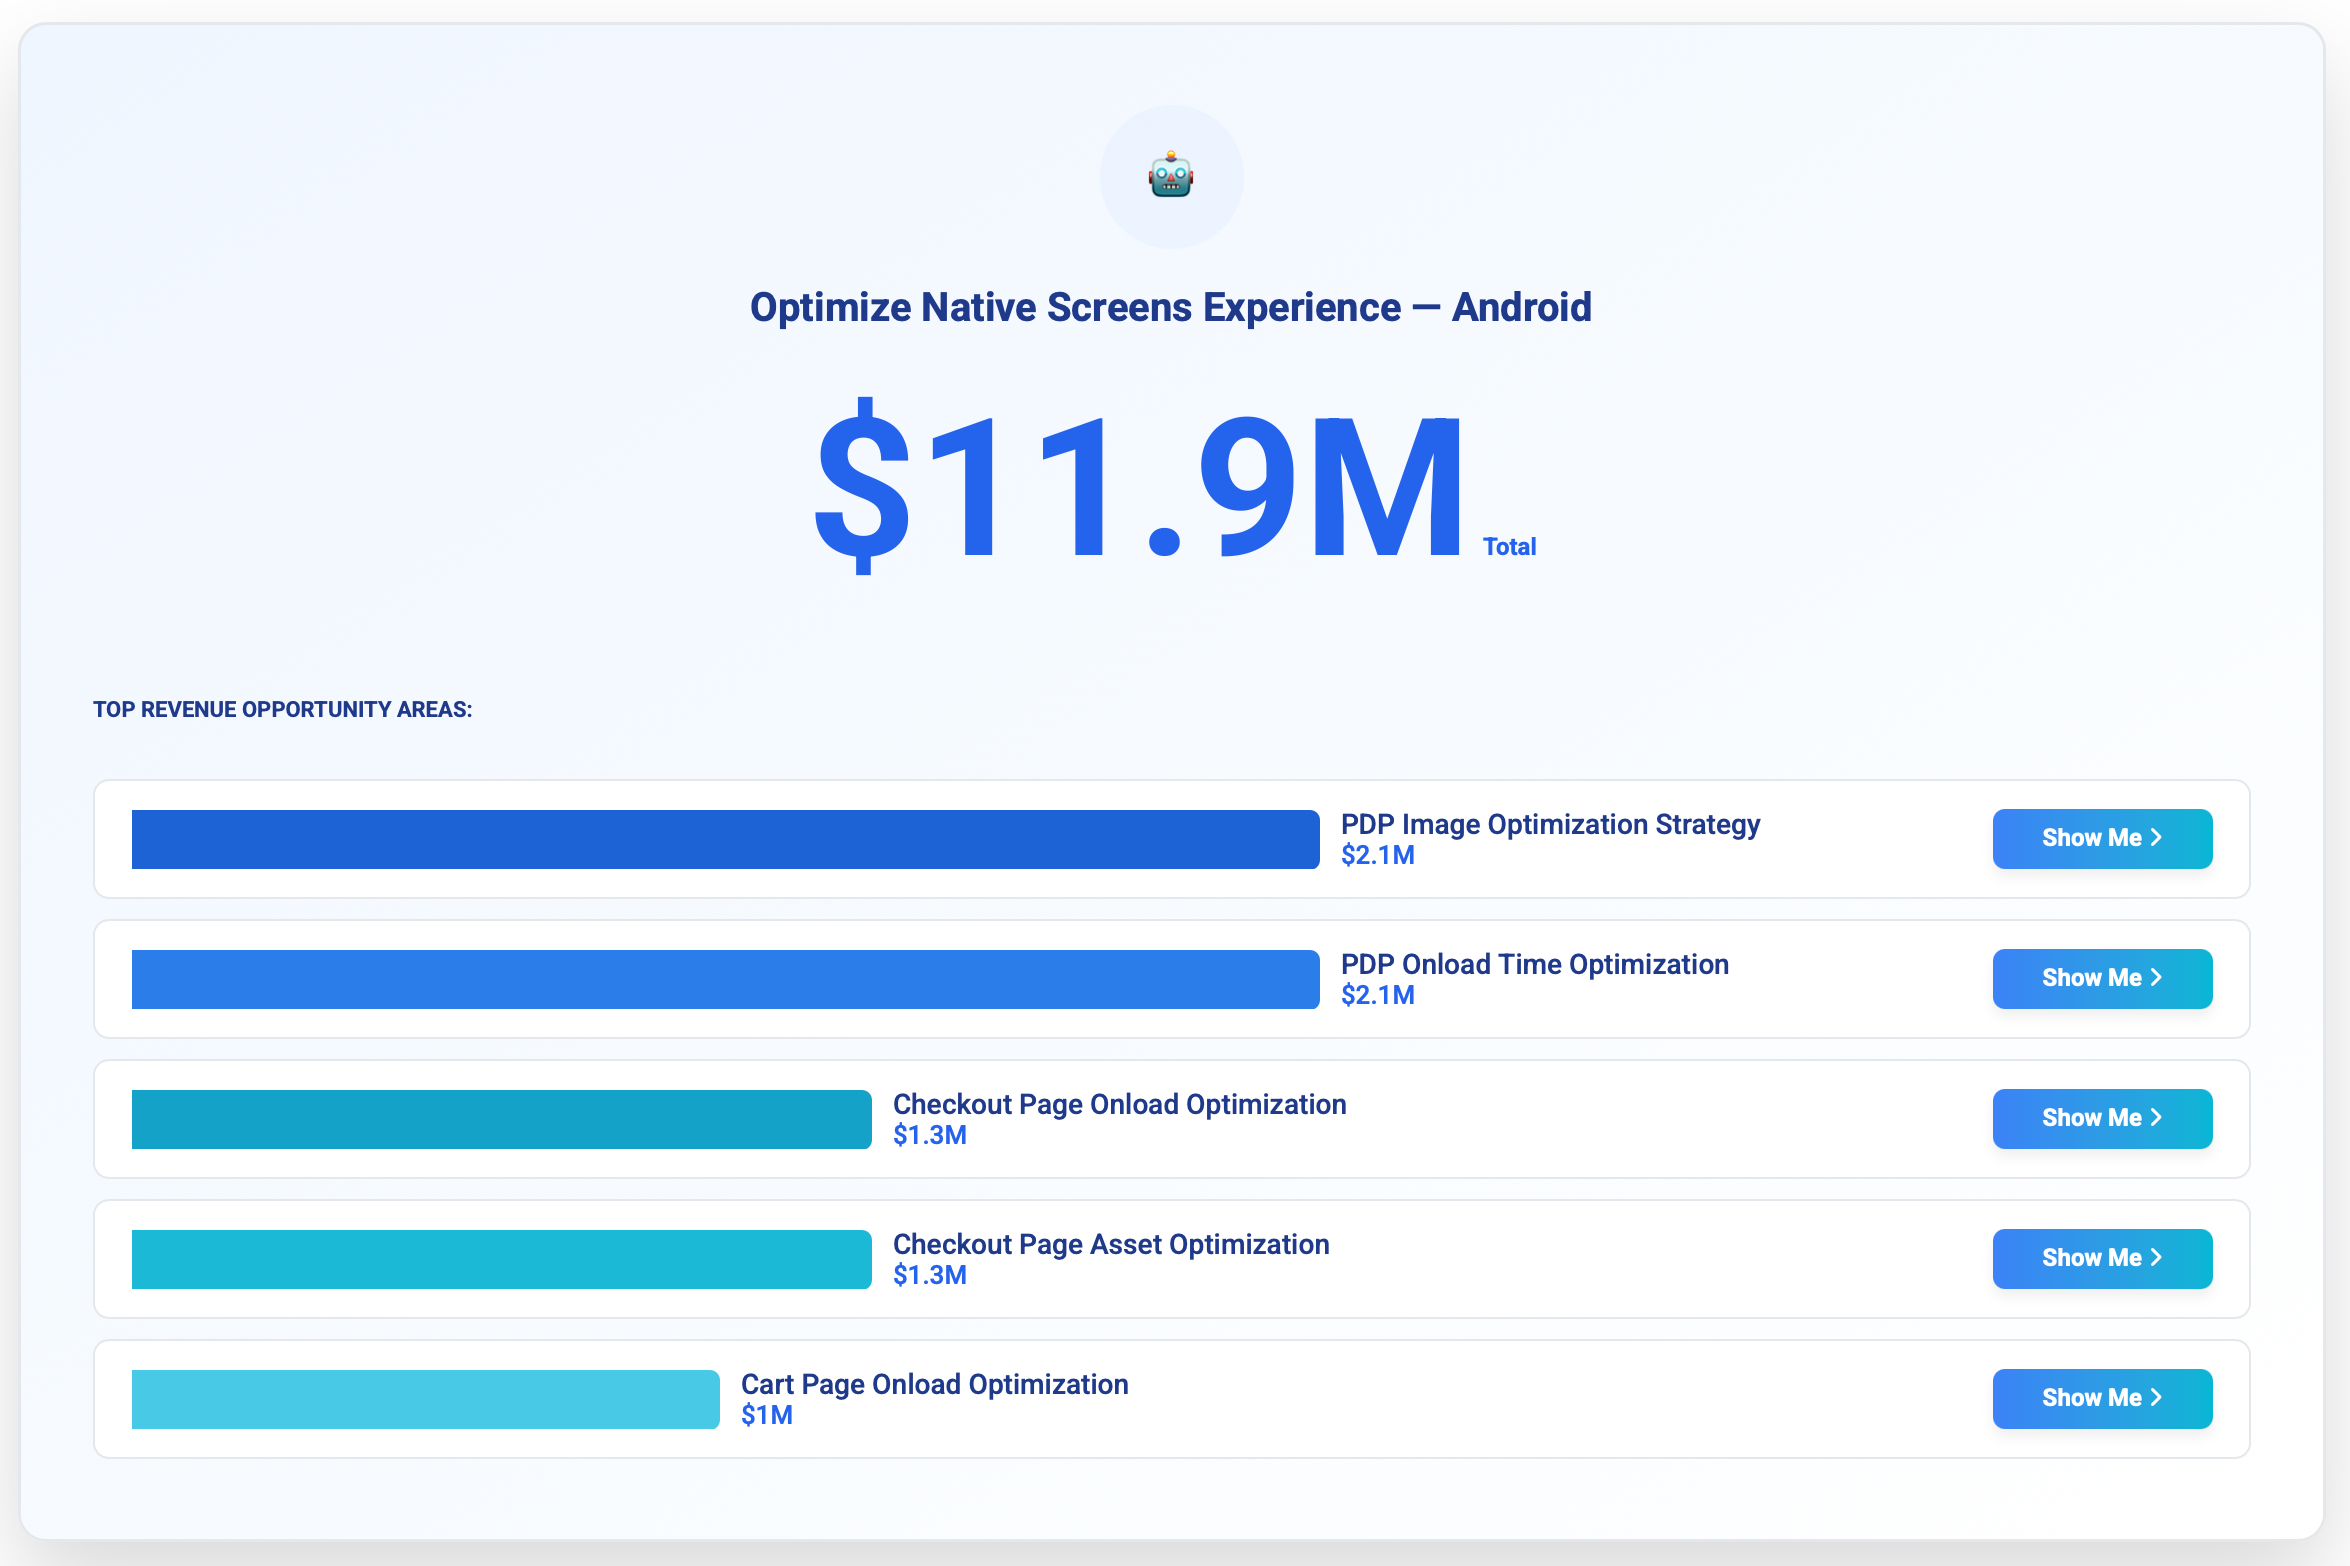
For every page on your site and every screen in your app, the CRC calculates a unique curve that translates friction directly into dollars lost. Not red flags. Not performance scores. Dollar figures — per page, per friction point, per day.
Refined over 10 years and billions of transactions across 150+ brands — the reason our revenue impact calculations are consistently accurate. Not estimates. Not benchmarks. Not industry averages applied to your data.