
Put revenue opportunity behind your priorities.
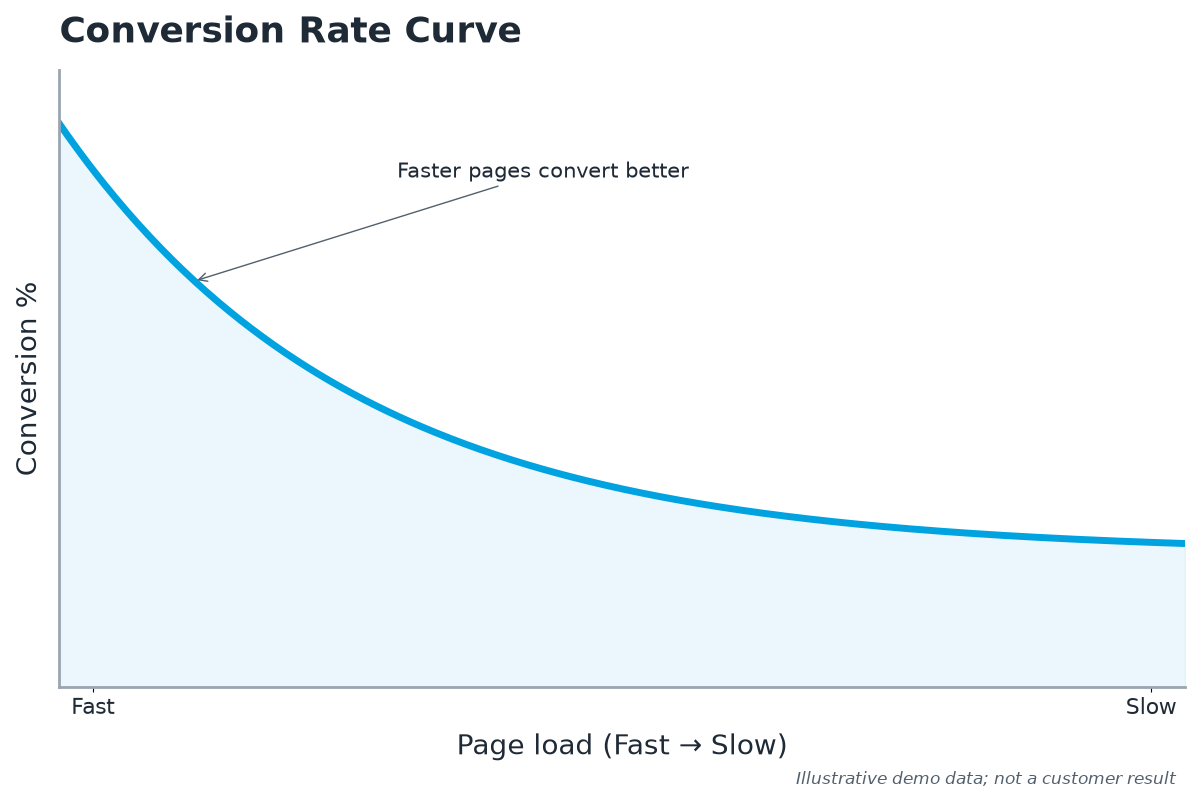
Our Conversion Rate Curve compares slower and faster page loads on the same page and device. Your measured conversion patterns help estimate where speed improvements could matter most. Your team gets page-level priorities grounded in its own business, rather than an industry average. These are estimates for prioritizing work; see what the estimate means below.
-
✓Compare revenue opportunity by page and device.
-
✓Rank speed improvements using your customers' behavior.
-
✓Give product and engineering a shared starting point.
Your measurement history makes the difference.
Blue Triangle collects experience data from your site and keeps it connected to conversion and revenue from the same visits. That history is the foundation of the analysis. An assistant can summarize the findings; it cannot recreate the measurements behind them by reading a screenshot.
How measurement starts
Add Blue Triangle's tag to your website, through a tag manager such as Google Tag Manager or directly. Mobile apps use a separate software integration. The tag collects experience measurements and connects them to conversion and revenue from the same visits.
What the estimate needs
- Experience, conversion and revenue data collected from your own visits.
- A starting point your team confirms against your analytics during onboarding.
- Enough slower and faster loads on the same page and device for a useful comparison.
What an assistant can and can't do
An AI assistant connected through Blue Triangle's MCP connector can request these findings and explain them in plain language. It can't create the measurements. Website text, a prompt or a screenshot doesn't contain your visits, conversions or history.
Tag setup with Google Tag Manager · Mobile app SDK guides · Connector setup
Chart: Illustrative demo data; not a customer result.
What does the estimate mean?
It is an opportunity estimate for deciding what to investigate first, not recovered revenue or a promise. Traffic mix, buyer intent and other business factors still matter, and some pages show a strong link between speed and revenue while others don't.
-
✓Per-page estimated revenue opportunity, updated from continuous measurement
-
✓Ranked by estimated impact, highest opportunity first