Which Friction Points Should Be Prioritized?
Unlike engineering-focused cloud observability tools that warn you when a technical issue interrupts the user experience, Blue Triangle goes beyond alerts. We quantify the cost of each friction point.
No other platform can match the friction quantified experience of Blue Triangle. We’re the only business outcomes solution uniquely built for Continuous Experience Optimization.
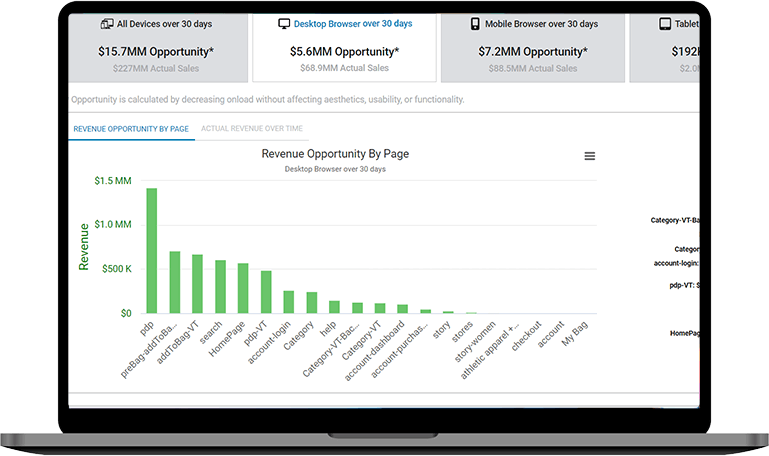
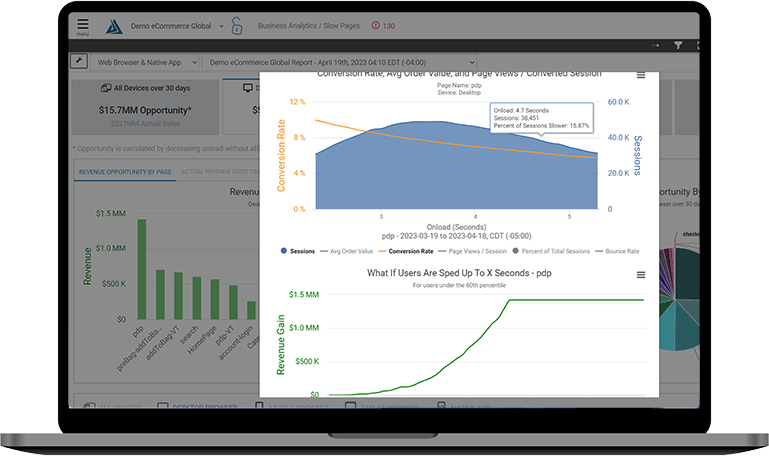
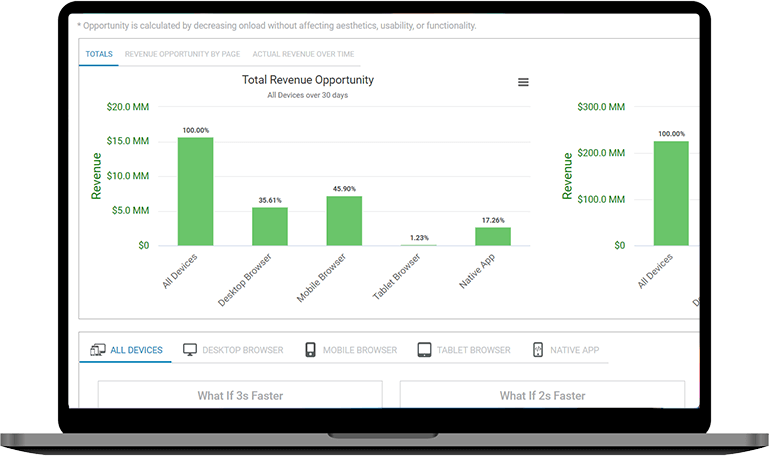
Quantify the cost of friction
Calculate the revenue impact of site performance and user friction for each page for desktop, mobile, tablet, and native app.
Explore All of the Ways Blue Triangle Customers Quantify
Friction on their Websites and Mobile Apps

Visualize conversion rates to understand customer drop-off.
Get the answers to your critical questions that you can’t get from your observability platform alone.
Last year, we uncovered an unbelievable $2.7 Billion for many
of the world’s leading online and omnichannel brands.









How much is revenue-robbing friction costing you?
Don’t spend another sleepless night worrying about slow webpages and site friction. We’ll help you get more sleep and revenue.

Listen and learn how experts at leading brands combat friction every day to create frictionless digital experiences.





.jpg)
