
Conversion Rate Curve: what page speed is worth on your site.
Blue Triangle compares slower and faster page loads on the same page and device, using your own customers' sessions, conversions and revenue. Where there is enough measured data, you get a revenue-opportunity estimate for each page, so your team knows what to fix first.
One curve per page, built from your customers' behavior.
The Conversion Rate Curve plots conversion rate against page response time, with sessions grouped in 0.1-second cohorts. It compares slower and faster loads on the same page and device, so the comparison is like for like.
Blue Triangle then applies that curve to your measured traffic and revenue to estimate what faster pages could be worth for the time period you select. It answers the question every speed project starts with: how fast does this page need to be, and what is it worth to get there?
-
✓Conversion rate against page response time, per page
-
✓Slower and faster loads compared on the same page and device
-
✓Revenue-opportunity estimates ranked across pages and devices
Bars show sessions in 0.1-second page response time cohorts. A line shows conversion rate falling as pages get slower. Faster loads are shaded on the left, slower loads on the right. Illustration only, not customer data.
What the curve needs before it calculates anything.
The Conversion Rate Curve does not run on industry averages or on what a website says about itself. Before Blue Triangle can estimate revenue opportunity for a page, it needs four things from your own site.
Load time for every visit
Blue Triangle's tag records how long each page took to load, visit by visit, on your site.
Whether that visit converted
Each visit is paired with its outcome from the same session: did it convert?
The revenue it produced
Revenue from those same sessions, so the estimate is in dollars, not a speed score.
Enough slower and faster loads
Enough sessions on the same page and device in both groups to make a useful comparison.
Setup and limits. It starts with adding Blue Triangle's tag to your website. Mobile apps use a separate software integration. We check the collected results against your analytics to establish a reliable starting point, and the analysis becomes more useful as your measurement history grows. This page, a screenshot or a prompt can't supply those sessions, conversions and revenue.
Want a first look before a full setup? The free Friction Quantified Analysis is intended for qualifying sites with at least one million monthly page views, where transactions have a revenue or business impact.
Measured by Blue Triangle. Explained by your assistant.
An AI assistant can explain what a Conversion Rate Curve is from this page. It can't produce your curve, because it doesn't have your visits, conversions or revenue. Here's where the line sits.
From your measured visits
- Page-load timing for each session on your site
- Conversion and revenue from those same sessions
- The curve and the revenue-opportunity estimate for each page and device with enough measured visits
- The history that lets your team assess what changed after a release
Explanation, on top of the numbers
- Plain-language answers about priorities, such as "What did slow pages cost us in conversions yesterday?"
- Draft summaries and recurring reports for your team
- Blue Triangle data alongside your analytics and APM tools in one conversation
Treat the assistant's explanation as a reading of your data, not as proof of revenue impact. The figures come from Blue Triangle's calculation on your measured visits.
Blue Triangle's connector uses the Model Context Protocol, an open standard that lets an assistant request data from another system, and works with supported assistants including Claude and Cursor. Read the August 2026 connector announcement →
From the curve to a fix, then to what changed.
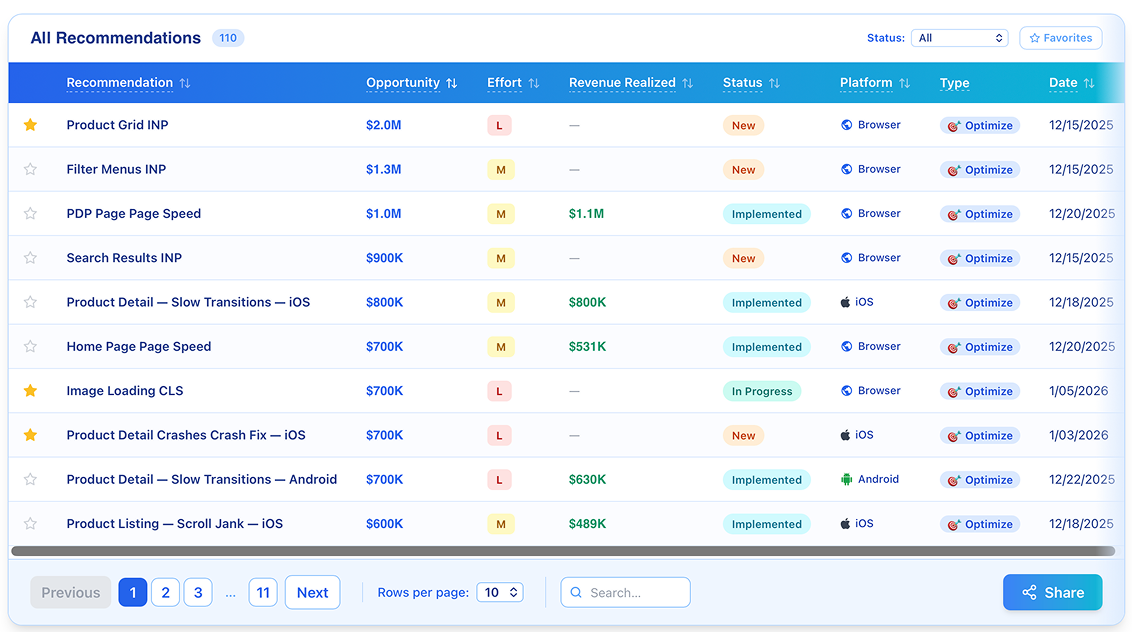
Pages ranked by revenue opportunity. Your team decides what to fix.
Where there is enough measured data, the curve turns each page's speed into a revenue-opportunity estimate, then ranks pages and devices so the biggest opportunity sits at the top of the list. Sprint planning starts with data, not debate.
AI recommendations are checked against your own measured data and our documented performance rules. Claims the data doesn't support are flagged and held back. A solutions architect has the final say, and your team decides what to ship.
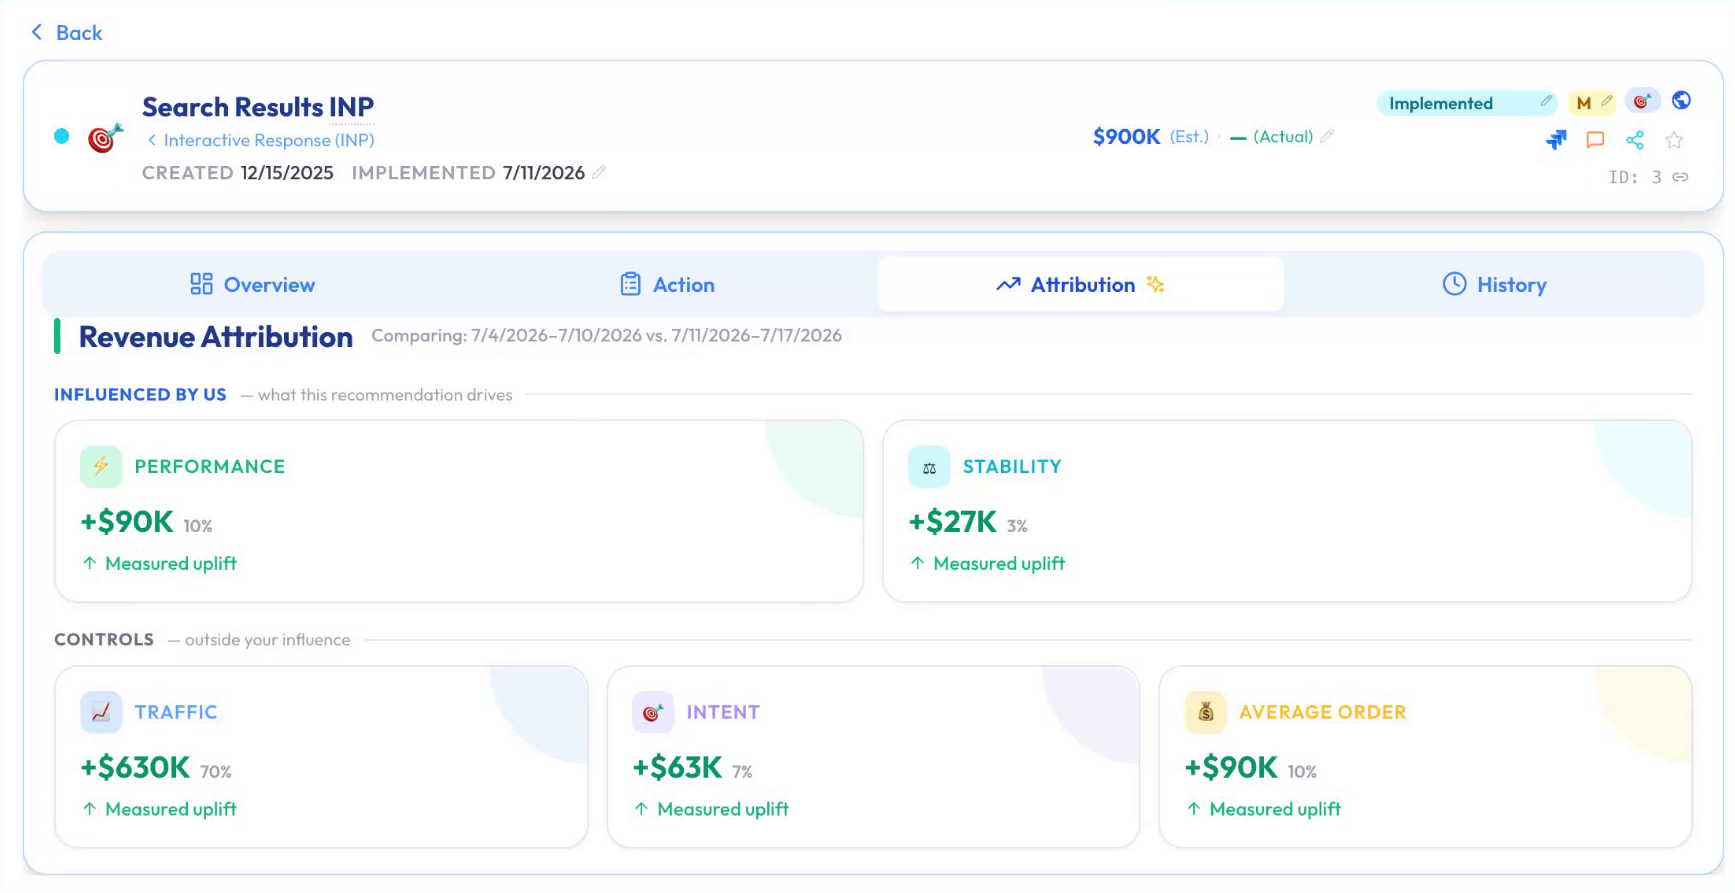
After the change, see what contributed.
After your team ships a change, Blue Triangle helps assess its estimated contribution to revenue. The attribution view helps separate experience changes from shifts in traffic, average order value and other business factors.
It estimates contribution. It does not claim that one fix caused all of the change, and it can't fully separate promotions or seasonality. Each pass adds to your measurement history, so the next estimate starts from your own results.
What the estimates mean, and what they don't.
- Estimates, not a guaranteed return. Revenue figures are estimates of opportunity for the selected time period. The model does not guarantee a particular return.
- Speed is one factor. Traffic mix, buyer intent and other business factors still matter. The dollar figures are page-load estimates for deciding what to work on first.
- Your history, not a benchmark. The curve uses your customers' behavior rather than applying an industry average to your site.
U.S. Auto Parts: which pages carried the largest revenue opportunity.
U.S. Auto Parts could see performance problems in other monitoring tools. Blue Triangle helped its engineering team identify which pages carried the largest revenue opportunity. After adding the tag, the team prioritized the shopping cart and homepage, removed or delayed nonessential third-party content, and improved two slow files.
The August 2018 case study reports a four-second improvement in DOM Interactive, a browser timing measure, and load-time improvements of 35% and 49% on those files. It reports that revenue opportunities were identified within a week of adding the tag. It does not publish a recovered dollar total.
Read the dated customer case →Conversion Rate Curve questions
What is a Conversion Rate Curve?
It's Blue Triangle's method for connecting page speed to revenue. It plots conversion rate against page response time, with sessions in 0.1-second cohorts, and compares slower and faster loads on the same page and device to estimate the revenue opportunity of faster pages.
What data does it need before it can estimate revenue opportunity?
Load timing for each visit, whether that visit converted, the revenue from the same session, and enough slower and faster loads on the same page and device to compare. Blue Triangle's tag collects these on your website. Mobile apps use a separate software integration.
How is it different from experience analytics or a performance dashboard?
Experience analytics shows where customers struggle. Ordinary dashboards show speed, conversion and revenue. Blue Triangle connects them: what happened during a visit, whether it converted and the revenue it generated, then estimates what that friction is worth.
Can an AI assistant calculate this from our website?
No. An assistant reading a webpage or screenshot doesn't have your sessions, conversion history or revenue. With Blue Triangle's MCP connector, an assistant can pull Blue Triangle's results and explain them, but it doesn't produce the measurements.
Are the revenue figures guaranteed?
No. They are estimates of opportunity for the selected time period, meant for deciding what to work on first. Traffic mix, buyer intent and other business factors still matter.
How do we check what changed after a fix?
Blue Triangle's attribution view helps separate experience changes from shifts in traffic, average order value and other factors. It estimates contribution, it can't fully separate promotions or seasonality, and it doesn't claim one fix caused all of the change.
More ways to quantify friction
The Conversion Rate Curve powers the other Quantify tools.
Revenue Opportunity
Per-page revenue-loss scoring ranked by impact.
Bottom-of-Funnel Analysis
Real-time conversion funnel health check.
Cost of Broken Links
Revenue lost to 404s, ranked by dollar cost.
See your own curve.
In a demo, we'll walk through how the Conversion Rate Curve would run on your site's sessions, conversions and revenue, and where your team could start.