
Core Web Vitals: know which problem to fix first.
Blue Triangle measures loading, responsiveness and layout on measured visits where collection and browser support are available. It shows where each problem is concentrated and points to the element or script behind it. Your team starts where it matters to your customers and your revenue.
A score tells you something is wrong. The breakdown tells you what.
Each Core Web Vital is one number. Blue Triangle's VitalScope splits it into the parts that make it up, on your measured visits, and names the element, selector or script responsible. That turns a score into a place for engineering to start.
It covers Largest Contentful Paint, Interaction to Next Paint and Cumulative Layout Shift, plus long animation frames. A long animation frame is a rendering update that takes more than 50 milliseconds; unlike a single long task, it includes all the script and rendering work in that frame.
-
✓Measured on real users' page views where collection is available
-
✓Filter by page, device and region
-
✓The element, selector or script behind the score, where the browser reports it
- Loading Server response Wait before loading Load time Render delay
- Responsiveness Input delay Processing Presentation
- Layout Largest shift and the element that moved
Three bars, one per Core Web Vital. The loading bar is split into four parts: server response, wait before loading, load time and render delay. The responsiveness bar is split into three parts: input delay, processing and presentation. The layout bar marks the largest shift and the element that moved. Illustration only, not customer data.
Loading, responsiveness and layout fail for different reasons.
That's why the three headline metrics alone aren't enough to plan the work. Here is what Blue Triangle shows for each.
Loading
How long the main content takes to appear. Blue Triangle splits it into server response, the wait before the main image or text starts loading, its load time and the delay before it renders. That shows whether the fix belongs to the server, the page code or the asset. Google's good threshold: 2.5 seconds or less at the 75th percentile, assessed separately for mobile and desktop.
Responsiveness
How long the page takes to respond after a tap, click or key press. Google's good threshold: 200 milliseconds or less at the 75th percentile, assessed separately for mobile and desktop. Blue Triangle shows the element and event behind slow responses, and whether the time went to waiting, running code or drawing the result.
Layout
How much the page jumps while it loads. Blue Triangle records when the biggest shift happened, how many shifts there were and which element moved. Google's good threshold: 0.1 or less at the 75th percentile, assessed separately for mobile and desktop.
A public score shows there's a problem. Your own visits show where and why.
Google's Chrome User Experience Report is a useful benchmark. It can't tell you which element slowed your checkout or which customers felt it.
Google's Chrome data
- Scores from Chrome users who share their data with Google
- Useful to compare your site with others
- Blue Triangle can show it next to your own data; it is Google's data, not a Blue Triangle measurement
Your measured visits
- Measured page views, filtered by page, device and region
- The element, selector or script behind the score, where the browser reports it
- Kept with conversion and revenue from the same measured visits
- A history, so your team sees when a problem started and checks the fix
An AI assistant connected through Blue Triangle's MCP server can answer questions such as "what's our LCP trend on the checkout page this week?" from your measured data. It reads the measurements; it can't create them. How Blue Triangle helps improve Core Web Vitals →
Start with the problem that reaches your most valuable visits.
Same problem, different priority, depending on the page.
Find it. Filter real-user results by page, device and region to see which pages and visitors get the slowest loading, the slowest responses or the most movement.
Weigh it. A slow checkout or product page with heavy traffic comes before the same problem on a page few buyers see. Blue Triangle keeps experience, conversion and revenue from the same measured visits together, so the comparison uses your numbers.
Open it. VitalScope names the element, selector or script behind the score, so engineering gets a starting point, not just a number.
Hand it off. To see how first- and third-party resources and domains loaded across many page views, open the Aggregate Waterfall.
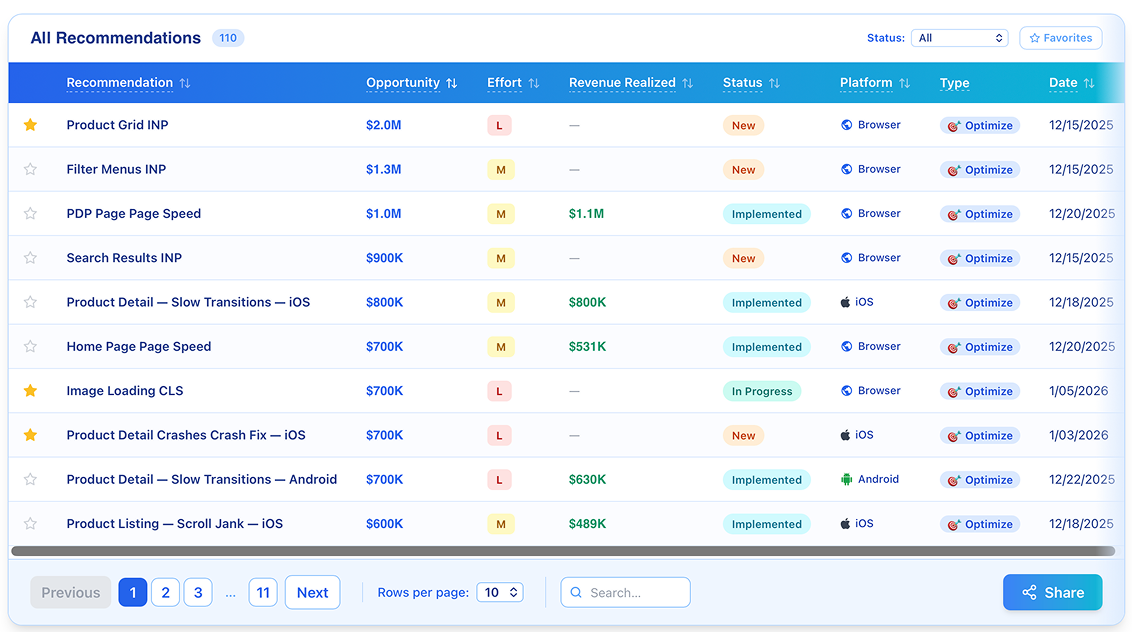
What a Core Web Vitals score does and doesn't tell you.
- A better score doesn't always mean more revenue. Some pages show a strong link between experience and conversion and others don't. Compare a problem against conversion and revenue on the same pages before you rank it.
- Some details can be missing. Blue Triangle uses Google's web-vitals library, and some browsers or elements don't report every detail. When the main content is text, it has no file address, so Blue Triangle shows the first 50 characters of that text instead.
- Lab tests and real visits answer different questions. Real-user INP reflects interactions during actual visits. Lab tests can simulate interactions to investigate responsiveness.
Core Web Vitals is part of Resolve: find the cause, then check the fix.
Quantify ranks pages by estimated revenue opportunity. Resolve, where Core Web Vitals sits, helps your team find why those pages are slow, unresponsive or unstable. Validate compares the week before and after the change to assess its estimated contribution.
Because the same measurements run through all three steps, the problem your team fixes is the one it measured, and results are assessed using consistent measurement across the comparison periods.
See how Resolve works →Core Web Vitals questions
What are Core Web Vitals?
Google's three measures of page experience: Largest Contentful Paint for loading, Interaction to Next Paint for responsiveness and Cumulative Layout Shift for layout. Interaction to Next Paint replaced First Input Delay in March 2024. Google's good thresholds are LCP 2.5 seconds or less, INP 200 milliseconds or less and CLS 0.1 or less, at the 75th percentile, assessed separately for mobile and desktop.
Which problem should we investigate first?
The one that reaches the most valuable visits. Find where each problem is concentrated by page, device and region, weigh it against conversion and revenue on those pages, then open the element or script behind it.
What is VitalScope?
Blue Triangle's root-cause view for Core Web Vitals. It breaks loading, responsiveness, layout and long animation frames into the element, selector or script responsible. It is part of real-user monitoring.
Does a better score always mean more revenue?
No. Some pages show a strong link between experience and conversion and others don't. That's why Blue Triangle compares problems against conversion and revenue on the same pages before you rank them.
Can a lab test or a screenshot find the same causes?
Partly. Real-user INP reflects interactions during actual visits. Lab tests can simulate interactions to investigate responsiveness. Blue Triangle's VitalScope shows the element, selector or script behind the scores on your measured visits, where the browser reports it.
Can an AI assistant answer Core Web Vitals questions?
Yes, from your data. The portal's AI Summary explains the data on screen, and Blue Triangle's MCP server lets an assistant such as Claude or Cursor query it. The assistant reads your measurements; it can't create them.
More ways to resolve friction
Core Web Vitals works alongside the other Resolve tools.
Customer Journey Analytics
Function Tracing
Conversion Rate Testing
Anomaly Detection
See which Core Web Vitals problem to start with on your site.
In a demo, we'll walk through where loading, responsiveness and layout problems reach your most valuable visits, and what's behind them.