.jpg)
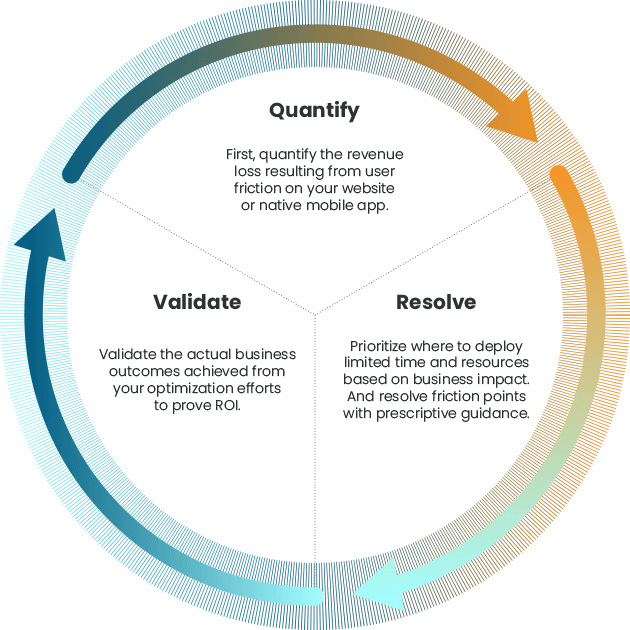
Like the directions on your shampoo bottle; rinse and repeat. To continually optimize the customer experience.
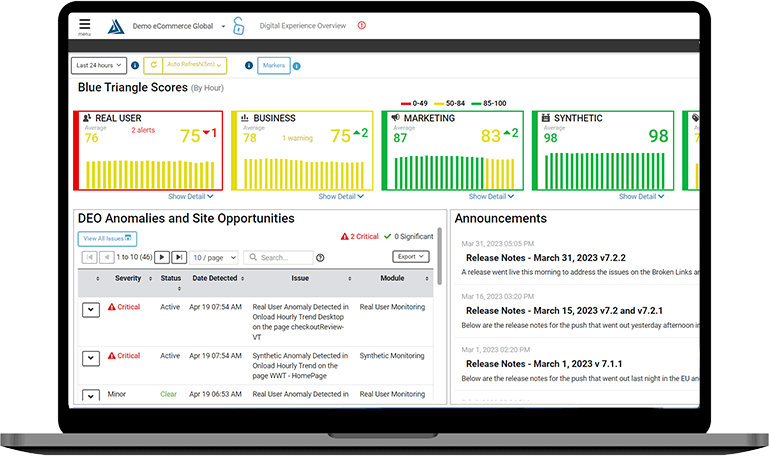
So, how do we do it? By unlocking and combining all your synthetic and real user monitoring data to calculate revenue opportunity and the precise cost of friction across every page and customer experience.
With Blue Triangle, teams can focus their efforts on creating a measurably-better frictionless digital experience and driving more revenue and customer loyalty.

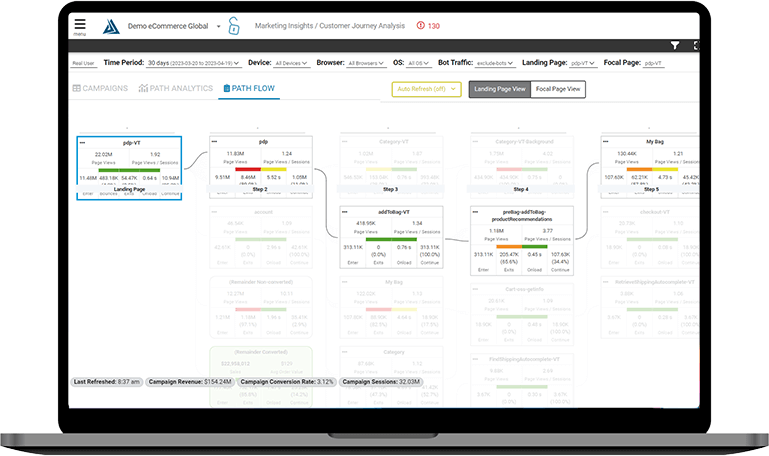
Make every optimization a business decision
Leverage insights from every customer journey to provide clear, prescriptive recommendations and tying each optimization back to revenue.


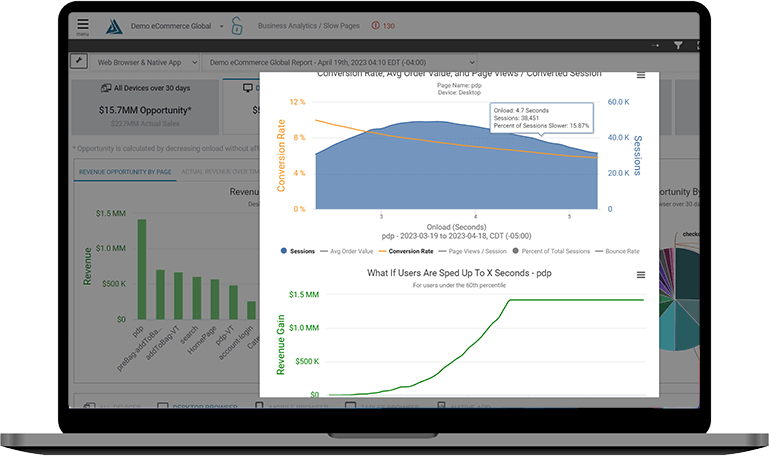
How can we validate the business outcomes from improving site speed?


Listen and learn how experts at leading brands combat friction every day to create frictionless digital experiences.