How can I tell which journeys are most frequently taken, where are customers struggling the most, and what's causing that to happen?"
Drive Customer Trust and Loyalty with Real-Time Customer Journey Insights
Every marketer understands the importance of delivering on consumers’ rising expectations for a frictionless experience and the challenge of archaic tools to keep up with fast-paced, complex journeys and connecting it to business outcomes.
-
Valuable customer experience data is siloed between business and technical teams, making it inefficient to communicate insights across teams.
-
Billions of meaningful data points are uncollected because tools can't fully process and prioritize the sheer volume of every customer interaction.
-
Many analytics tools overlook the entire customer journey and the increasing importance of mobile app journeys.
To drive frictionless digital experiences and grow revenue in today’s increasingly omnichannel data-dependent world, you need a platform that gives you insights into every customer journey so you know where they convert, and where and why they leave.
The customer journey analytics captured in our Continuous Experience Optimization platform is your answer to analyze every customer experience across all digital channels, not just desktop.

MAKE DATA DRIVEN DECISIONS IN MINUTES, NOT DAYS.
Forget waiting 24 hours for insights from Google Analytics. Pinpoint in real-time every customer interaction leading to a conversion or bounce, so you can fine-tune pages and campaigns within minutes of their launch and drive maximum conversions.

Blue Triangle allows me to track the traffic on my website and see where clients or potential customers are navigating. Before using Blue Triangle, I did not really know what areas were getting attention and which ones were not receiving any traffic.
Verified User
Engineer

UNDERSTAND CUSTOMER BEHAVIOR THROUGHOUT YOUR SITE OR MOBILE APP, AND THE IMPACT OF CHANGES.
Gain a holistic view of the customer journey by integrating data from different sources, channels, and digital touchpoints to isolate precise sources of friction undermining the performance of your marketing campaigns.

Blue Triangle's ability to record, capture, display, and provided a mechanism to dissect real-user traffic is instrumental in highlighting areas for opportunity for overall site improvement from the codebase, customer experience, and revenue.
Verified User
Enterprise Retail

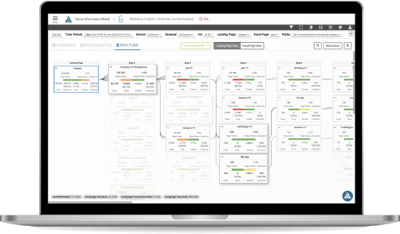
VISUALIZE HOW CUSTOMERS FUNNEL THROUGH AND INTERACT WITH YOUR SITE OR APP.
Understand every converting and non-converting path new and returning customers take on your site or mobile app, driven by organic traffic, marketing campaigns, and owned, paid, and earned media.

We've used the Real User Monitoring to look into a variety of topics, such as: bounce rates, top converting paths, campaign journey flows, revenue opportunities for tag governance, and CSP implementation, to name a few.
Verified User
Enterprise Retail
Last year, we uncovered an unbelievable $2.7 Billion for many
of the world’s leading online and omnichannel brands.



Explore More Ways to Resolve Friction
How much is revenue-robbing friction costing you?
Don’t spend another sleepless night worrying about slow webpages and site friction. We’ll help you get more sleep and revenue.
.jpg)
