The Frictionless Experience: The podcast where we slay friction one episode at a time  Listen to the podcast

“Despite investing in observability and monitoring tools, figuring out what changes happened that resulted in a sudden performance issue on my site takes hours and money to figure out. How can I easily understand what happened and how to fix it?”

Skip the Guesswork and Validate Your Business Outcomes

When a page suddenly starts under-performing or over-performing, it can rob hours from valuable resources for even the best development teams to understand what the heck is going on.


It can feel impossible to fully understand what exactly changed on the site and is now creating user friction. Or what changed and miraculously cleared up friction.


Despite investing in observability tools, figuring out what changes happened (across various teams making changes) that resulted in a sudden performance issue can tie up valuable resources for many hours costing us time and money.

What if you see a jump in a Core Web Vital score? Or a site performance metric has gone from green to red one day, and back to green the next day?

Identify in minutes what changed on a specific page that’s causing performance degradation or improvement.


img_vo_what_changed_01

UNDERSTAND AND VALIDATE THE IMPACT OF CHANGES ON THE USER EXPERIENCE AND BUSINESS OUTCOMES.

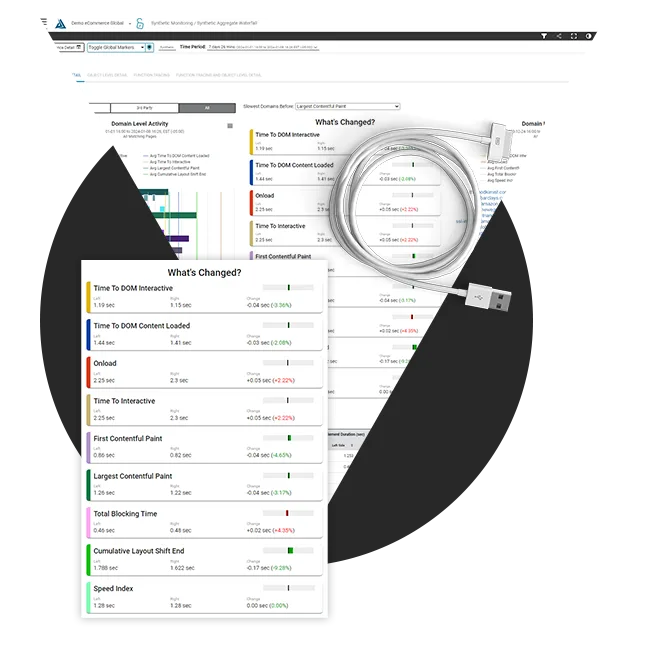
Save hours of wasted time and answer the critical question, "What's Changed?". Quickly isolate what was added or removed from a page affecting performance, customer experience, or revenue outcomes.


G2_Logo_Red_RGB

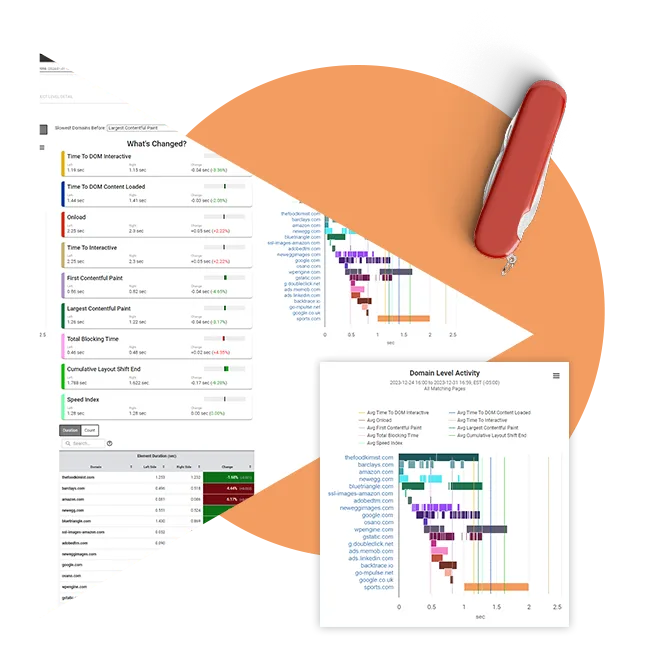
I am able to get both high level and detailed aggregate data across a large time frame.

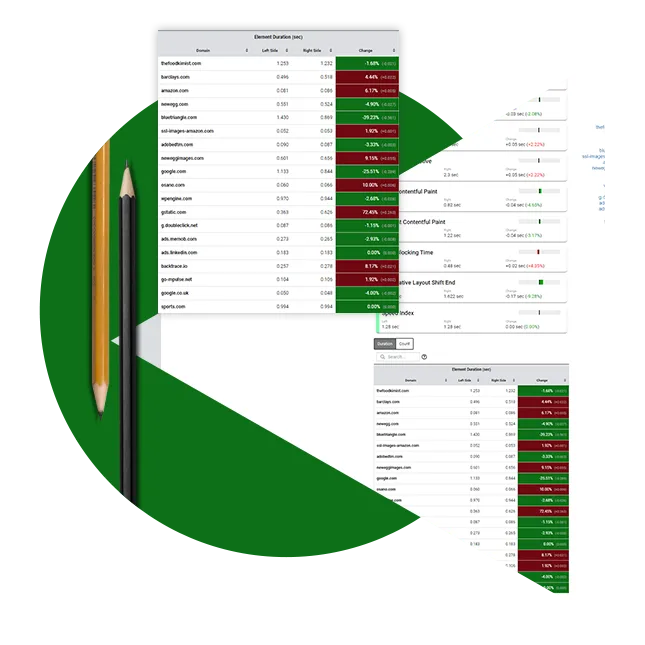
The Comparison ability is currently unmatched in all the monitoring products I have tested. 

Kevin J.

Digital Performance Lead

img_vo_what_changed_02

PROVE PERFORMANCE AND BUSINESS SUCCESS.

Pinpoint with precise detail how your specific friction-removal optimizations changed user experience and revenue.

Rick C.

When we followed Blue Triangle's advice conversion increased just like the tool predicted.

Rick C.

Director of Web Solutions

img_vo_what_changed_03

AVOID THE FRUSTRATION AND UNCERTAINTY OF MANUALLY ANALYZING DATA.

Automatically compare different time periods without manually trying to figure it out. Analyze if site releases or certain third-party services are degrading site performance.

bt-safron-user-img-2

Blue Triangle will give you the data you are missing to address the areas that most impact the bottom line.

Erick L.

Lead Performance Architect

Get the answers to your critical questions that you can’t get from your observability platform alone.

Unbelievable? Yeah, that's what our customers thought. Before we turned impressive business performance into undying customer loyalty.

Marriot
Boohoo
Moxy
Burton
Aloft hotels
La quinta
Primeline
Barclays
Vacasa
Wingate
Courtyard hotels
Ballard designs
Lowes
Garnet hill
Staples
Kate spade
Living spaces
Kaiser Permanente 2008
Radisson hotels
Equifax
Hawthorn suits
Gaylord
Dicks
Residence inn
St regis
Urban outfitters
Zales
Chewy
Aetnahealth
Diamonds direct
Lululemon
Walgreens boots alliance
Home depot

How much is revenue-robbing friction costing you?

Don’t spend another sleepless night worrying about slow webpages and site friction. We’ll help you get more sleep and revenue.