The Frictionless Experience: The podcast where we slay friction one episode at a time  Listen to the podcast

“How can we prove to leadership the effectiveness of our optimizations on business outcomes and gain executive buy-in for more investment?”

From Dashboards to Dollars, Replace Hunches with Proof Points

Teams use dozens of dashboards and reports to run daily. And continuously monitor website performance to find friction and predict trends before they affect the customer experience. Or hurt your key performance indicators (KPIs).


But executives need to gain alignment quickly. And get high-level visibility into what matters most to the business. Unless it impacts the bottom line (like generating revenue, improving customer loyalty, or reducing costs), they don’t have the time or patience to look at anything else.

What if there was a way to communicate directly with peers, teams, and executives across your organization to discuss business-critical issues and initiatives?

Then, it would be possible to adopt an effective company-wide culture of Continuous Experience Optimization to make more informed decisions about how to continually perfect the digital experience and achieve the greatest revenue and business outcomes.

The Executive Trend Report provides a site-wide overview of your key performance and business metrics. It connects site performance to business outcomes in one, holistic view.


Blue Triangle Executive Trend Report

ENSURE SHRINKING BUDGETS ARE BEING SPENT WISELY ACROSS YOUR ORGANIZATION.

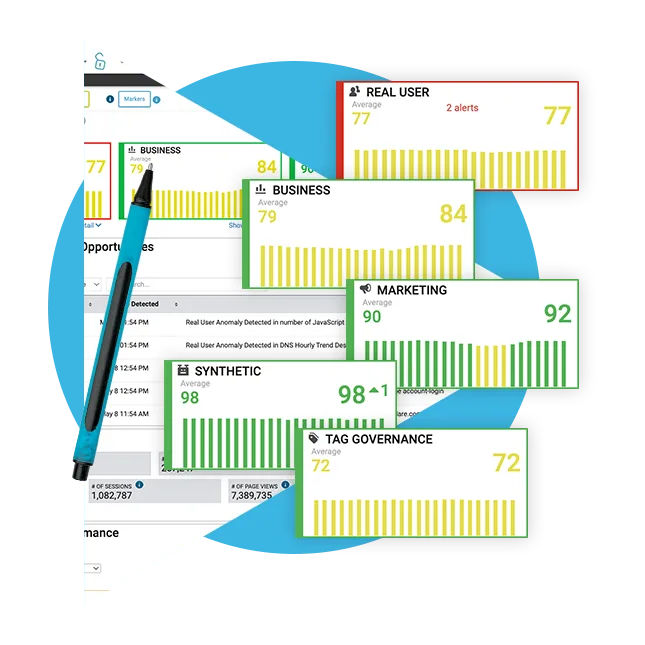
Gain high-level visibility and alignment across your organization's key metrics to inform executive decision-making and achieve Continuous Experience Optimization.

Capterra Logo

In a single product, you are able to see business and performance KPIs. You can easily correlate business and performance metrics answering easily to the key question, "How is the performance of your website impacting the business?".

Antonio B.

Senior Solution Engineer, Information Technology & Services

img_vo_executive_trend_02

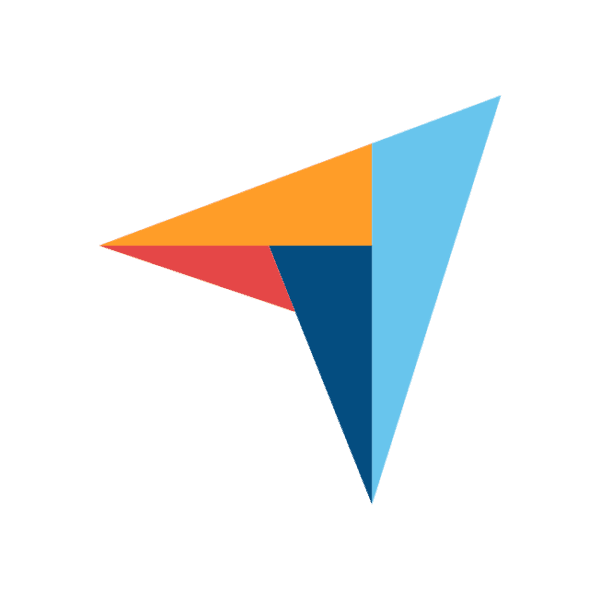
FOCUS LIMITED RESOURCES TO RESOLVING REVENUE-ROBBING FRICTION, GETTING THE MOST BANG FOR YOUR BUCK.

For Executives, gain insights into your website's impact on revenue and business outcomes in a streamlined report.

Rick C.

When we followed Blue Triangle's advice conversion increased just like the tool predicted.

Rick C.

Director of Web Solutions

img_vo_executive_trend_03

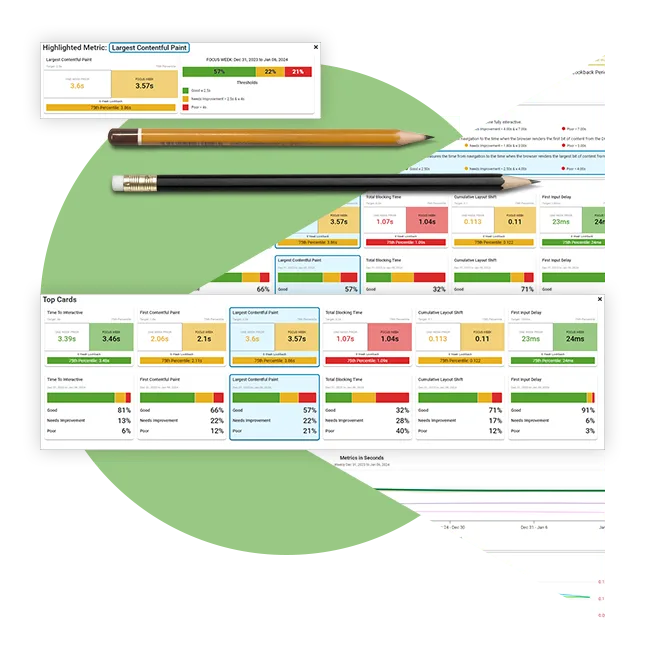
VALIDATE THAT YOUR ORGANIZATION IS GENERATING A FAR GREATER RETURN THAN WHAT WAS SPENT TO RESOLVE FRICTION.

Take the guesswork out of investing in the digital experience with a clear understanding of how conquering friction is driving your business and maximizing ROI.

bt-safron-user-img-2

Blue Triangle will give you the data you are missing to address the areas that most impact the bottom line.

Erick L.

Lead Performance Architect

Get the answers to your critical questions that you can’t get from your observability platform alone.

Unbelievable? Yeah, that's what our customers thought. Before we turned impressive business performance into undying customer loyalty.

Marriot
Boohoo
Moxy
Burton
Aloft hotels
La quinta
Primeline
Barclays
Vacasa
Wingate
Courtyard hotels
Ballard designs
Lowes
Garnet hill
Staples
Kate spade
Living spaces
Kaiser Permanente 2008
Radisson hotels
Equifax
Hawthorn suits
Gaylord
Dicks
Residence inn
St regis
Urban outfitters
Zales
Chewy
Aetnahealth
Diamonds direct
Lululemon
Walgreens boots alliance
Home depot

How much is revenue-robbing friction costing you?

Don’t spend another sleepless night worrying about slow webpages and site friction. We’ll help you get more sleep and revenue.