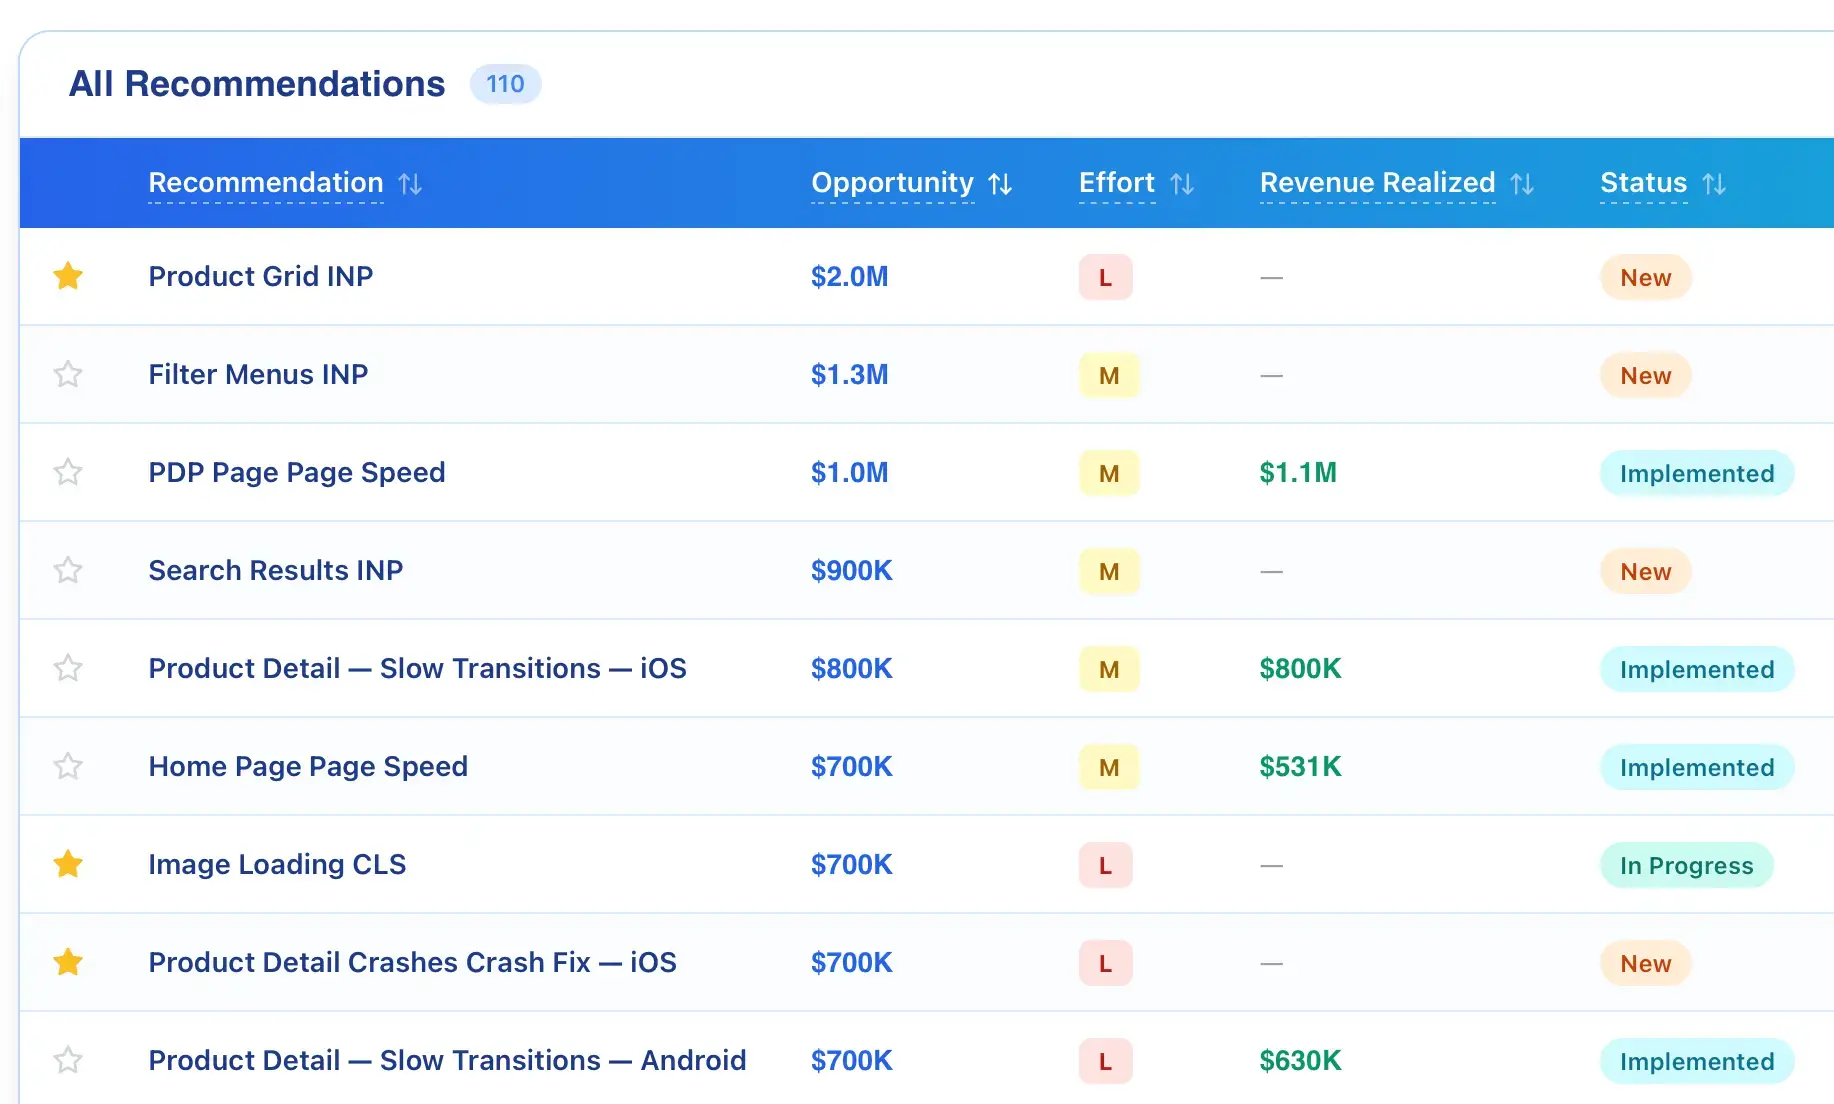
The Frictionless Experience: The podcast where we slay friction one episode at a time  Listen to the podcast

Which Friction Points Should Be Prioritized?

Unlike engineering-focused cloud observability tools that warn you when a technical issue interrupts the user experience, Blue Triangle goes beyond alerts. We quantify the cost of each friction point.

No other platform can match the friction quantified experience of Blue Triangle. We’re the only business outcomes solution uniquely built for Continuous Experience Optimization.

bt_qf_revenue_opportunity-1.png
bt_platform_conversion_rate_curve-1.png
bt_qf_revenue_opportunity_by_page-1.png

Quantify the cost of friction

Calculate the revenue impact of site performance and user friction for each page for desktop, mobile, tablet, and native app.

Allocate limited resources

Unify functional teams to focus on resolving friction that causes the most customers to abandon your site for a competitor.

Regain time and money

Prioritize fixing the pages costing the most money to drive the highest incremental revenue opportunity possible.

Get the answers to your critical questions that you can’t get from your observability platform alone.

Last year, we uncovered an unbelievable $2.7 Billion for many
of the world’s leading online and omnichannel brands.

Marriot
Boohoo
Moxy
Burton
Aloft hotels
La quinta
Primeline
Barclays
Vacasa
Wingate
Courtyard hotels
Ballard designs
Lowes
Garnet hill
Staples
Kate spade
Living spaces
Kaiser Permanente 2008
Radisson hotels
Equifax
Hawthorn suits
Gaylord
Dicks
Residence inn
St regis
Urban outfitters
Zales
Chewy
Aetnahealth
Diamonds direct
Lululemon
Walgreens boots alliance
Home depot

How much is revenue-robbing friction costing you?

Don’t spend another sleepless night worrying about slow webpages and site friction. We’ll help you get more sleep and revenue.