.svg)

Why does Lighthouse matter?
 Lighthouse is a critical, open-source tool used by web developers to benchmark their web applications and sites over time and to gauge how well they are performing relative to Google’s expectations. There are separate scores within Lighthouse:
- Performance score
- Code best-practices score
- SEO score
The performance score is what impacts your site. While following recommended best practices for code and SEO generally lead to better performance outcomes too, we will be focusing on what goes into the performance score here, and answer the following questions:
- How does the performance score impact a site or web application?
- How does Lighthouse work?
- How are Lighthouse performance scores calculated?
- What are the metrics and how are they weighted?
- How are the metrics calculated? And what is a good score?
- How can I make Lighthouse scores consistent?
- What is the difference between Lighthouse, synthetic monitoring, and real user monitoring?
- What else should I track?
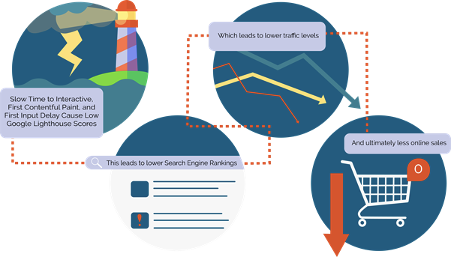
How does the performance score impact a site or web application?
Google’s expectations for performance are important – they use performance to rank web applications and sites in their search engine results, and tell developers to follow the guidelines set in Lighthouse. Google’s dominance in the market as a search engine makes it critical for web developers to heed the numbers reported for each performance metric that goes into Lighthouse and to understand how the metrics work.
Luckily the brains behind Lighthouse have made it their mission to provide clear guidelines for performance on sites. The documentation is extensive, and we will cover the highlights here.
How does Lighthouse work?
Understanding that Lighthouse is a tool used by Google and others is important. The fact that Lighthouse is a tool means that different uses of the tool result in different outcomes.
Developers can run Lighthouse locally on their browsers, but there are other methods for using it, too. They can also track the same metrics that are in a Lighthouse score across their user base with real-user monitoring, or synthetically using a synthetic monitoring provider.
There are a few distinct ways to run Lighthouse on a computer:
- In Chrome DevTools
- From the command line
- In npm
- In a browser at https://web.dev/measure/ or https://developers.google.com/speed/pagespeed/insights/
Like any software tool, Lighthouse generally gets better results on faster, newer computers than on slower, older ones. Here are a few aspects that can affect Lighthouse scores in different situations when you run it on a computer:
- A computer’s hardware, like CPU, GPU, and RAM
- How fast the internet connection is on a computer, including latency and bandwidth
- Internet routing, which is what path your computer takes to get the website or web application when Lighthouse is auditing the results
- The browser used
- The extensions that are on the browser
How are Lighthouse performance scores calculated?
Lighthouse documents how the metrics it uses are measured in a browser. They also document how much each metric affects scoring, as well as what constitutes a “good” result.
Different kinds of metrics go into calculating the total score, all of which broadly relate to performance. Each metric will be measured, with different results corresponding to different scores out of 100. That metric’s score is given a weighting toward the overall score out of 100.
There are two broad categories for these metrics:
- Timing metrics deal with how quickly a web app or page can meet a defined set of conditions while it loads from the Internet. They can be broken down further by where they occur in the loading process:
- Early in the load time
- Middle of the load time
- End of the load / after the load has finished.
- Other metrics deal with things like stability.
Each time Lighthouse runs, it will measure one load of the page or web application on a desktop and report both a desktop score and a mobile score based on its mobile simulated throttling calculations.
What are the metrics and how are they weighted?
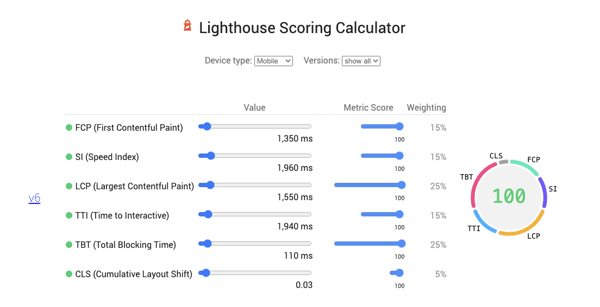
The metrics Lighthouse uses change depending on the version. The current version is Lighthouse v6, which surfaces well with the Web Vitals project Google announced earlier this year. With each version, the weighting of metrics that are still being used typically shifts and the current version has shifted to reflect the Core Web Vitals in that project.
Two metrics currently have the highest weights, accounting for 25% of the total score each. They are:
- Largest Contentful Paint (LCP)
- Total Blocking Time (TBT)
These are followed by three metrics that control 15% of the total score each:
- Time To Interactive (TTI)
- First Contentful Paint (FCP)
- Speed Index (SI)
Finally, Cumulative Layout Shift (CLS) account for just 5% of the total score.
This is a huge departure from Lighthouse v5. In that version, TTI was the most crucial score for performance, holding a third of the total weight. That weight has been halved.
How are the metrics calculated? And what is a good score?
Each of these metrics have their own set of parameters, which you can read about in the documentation for Lighthouse. There are a lot of considerations for each that are too extensive to cover here. But let’s talk about what a “good” score is.
“Good” is a range of values where Lighthouse says performance is expected for current web conditions.
The minimum score out of 100 needed for a "good" result is 90, but the exact requirements for that minimum good score vary by metric. Feedback may be less than “good”. Here are the different feedback ranges as the score decreases:
- Good: 100 - 90
- Needs improvement: 89 - 50
- Poor: 49 - 0
The time allowed for a good TTI score will be greater than a good FCP score due to the nature of how applications and webpages load. For example, a good Largest Contentful Paint happens within the first 2.5 seconds of the load, while a good Cumulative Layout Shift happens within 0.1 seconds.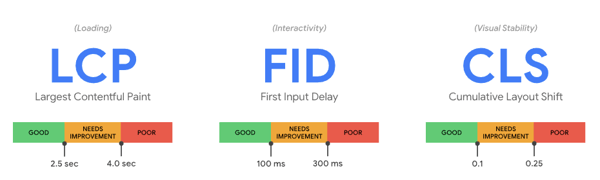
What constitutes a good score varies by metric and is set by Lighthouse. Although it is not clear how the ranges correlate to search results in Google, the value ranges correspond to user experience studies performed by Google. A site or application with a good score will also rank higher than one with a poor score. To get a good overall Lighthouse Score, most of the metrics must meet or exceed the set standard for “good”.
Here is a quick rundown of the maximum time for each metric on the Lighthouse v6 calculator that still results in a minimum score of 90:
- FCP (First Contentful Paint): 2,360 ms
- SI (Speed Index): 3,420 ms
- LCP (Largest Contentful Paint): 2,520 ms
- TTI (Time to Interactive): 3,830 ms
- TBT (Total Blocking Time): 290 ms
- CLS (Cumulative Layout Shift): 0.10
How can I make Lighthouse scores consistent?
Lighthouse recommends (1) using simulated throttling that matches Google’s “Slow 3G” speed for the mobile portion, (2) running multiple measurements, and (3) using a consistent environment over time for benchmarking.
- Lighthouse recommends simulated throttling because Google uses desktop measurements using simulated throttling f to determine Lighthouse scores. Whenever a Lighthouse measurement is run, both a desktop and mobile score will be provided.
- The second recommendation for multiple measurements is due to the variability inherent between measurements on any given machine. Five is the recommended number of measurements for accuracy at any given point in time.
- The third recommendation for a consistent environment comes from the variability between different computers, browsers, and internet connections that was outlined earlier.
Something important to note is that variability is inherent in Lighthouse measurements, and not all can be mitigated by following these strategies. In our next post in this series, we will address some of the issues inherent with Lighthouse and the decision to use simulated throttling for measurements.
What is the difference between Lighthouse, synthetic monitoring, and real user monitoring?
Measuring Lighthouse metrics with any other tool will result in different numbers. Monitoring these metrics synthetically without Lighthouse or monitoring them in real user traffic will result in different measured values than the values measured through Lighthouse.
For instance, Lighthouse generates its own measures of LCP through the simulated throttling mechanism. Here are two cases where that matters:
- If you measure LCP synthetically using a different tool, that kind of simulation will not be repeated.
- For real user monitoring, the metrics are accurate to your real user traffic. LCP of real users reflects their experience.
While Lighthouse results might correlate to the results generate by these other tools, the results for each tool are relative to themselves.
Still, because each metric has a specific method for calculation, improving the measurements for a metric using one tool should result in some improvement when measuring the same metric with a different tool. To continue the example, improving LCP for your real users should also improve LCP when you measure it during a synthetic page load or using Lighthouse.
What else should I track?
Lighthouse performance metrics are centered around user experience. Tracking them with real user monitoring is a great idea because you can correlate them to business outcomes. Using Blue Triangle, that correlation becomes even more powerful — performance gets tied to outcomes on individual pages and on specific paths through your web application.
Monitoring the same metrics over time with synthetic monitors is also a good idea. The consistency synthetics provide will allow you to see instantly when a metric that your users rely on is suffering.
In summary:
- Real user monitoring gives you an accurate picture of user experience and outcomes but with more variability
- Synthetic monitoring gives you a benchmark accurate to your site that may not necessarily reflect user experience
- Lighthouse allows you to benchmark your performance relative to SEO but with more variability and far less control
We believe knowing the strengths and limitations of the different tools at your disposal is essential in an ever-changing environment like the web. In our next part in this series, we will talk about preparing for some of the changes Google will be making to its performance scoring in the future, as well as what exact performance aspects influence the SEO of sites.
Let us know if you have any questions!