.svg)

Why do performance + experience matter for SEO?
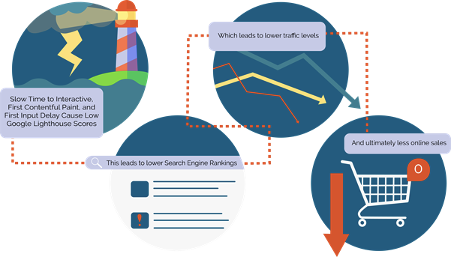
>Performance >is >a key element in helping Google rank sites in search results>. >G>oogle >handles almost all Internet searches> in the US, with about 88%> market share. It >comes as >no surprise >that marketers> care about optimizing their organic search traffic, and they should.>
>
Welcome to part two in our series on the impact of performance on SEO. While the first post in this series discussed the performance metrics and corresponding results that Google emphasizes, today we will be discussing the actual methodology Google uses for creating their search algorithms, as well as the impact that site performance has on these algorithms.
Google’s emphasis on performance + experience
Google has been pushing the importance of web performance in recent years in the name of improving user experience. Here is a rough timeline of the changes they have made to their search engine algorithms and indexing methods to reflect this emphasis:
April 2010: Desktop page speed is used in search ranking
March 2018: Mobile-first indexing for some sites rolls out
July 2018: Mobile page speed factors into search ranking
November 2018: Lighthouse starts powering Page Speed Insights
May 7, 2019: Lighthouse v5.0 released
May 7, 2019: Googlebot starts using the latest version of Chromium for rendering
March 2020: Mobile-first indexing announced for the entire web starting September 2020
May 5, 2020: Web Vitals program announced
May 19, 2020: Lighthouse v6.0 released
May 28, 2020: Core Web Vitals to be incorporated into search rankings in 2021 at the earliest
July 2020: Mobile-first indexing pushed back to March 2021 for entire web
From these changes, you can see that Google is working out the best way they can measure performance equally and fairly across the web. But that process is still in progress, and the goal posts are moving. Today we will explore some of the implications of these changes in the context of Google’s search results rankings.
How does Google determine search results rankings?
Google is notoriously tight-lipped about the exact means and methods used to provide search results rankings. Updates to the result ranking algorithms occur periodically, and while they share general principles, details about changes are left vague.
Google does leave some clues about how they gather data for their algorithms, but to find the clues, you need to understand how Google provides search results in the first place.
All about Googlebot
The foundation of Google’s search results is their web crawler, Googlebot. Googlebot gathers information about:
- What new websites have been created recently
- Page structure and other browser data of the pages for different sites that it visits
- The content of each page visited
Googlebot might collect more than that, but this is the data collection that Google has confirmed. The purpose of the data gathered is to provide context to the algorithm for providing search results.
In Google’s article on how their search functionality works, they outline 3 basic steps:
- Crawling the Internet
- Indexing sites
- Serving (and ranking) sites in search results
Googlebot accomplishes both crawling and indexing simultaneously, but it crawls and indexes multiple times. The first time a site is measured by Googlebot, it will be either the mobile or desktop version of Googlebot. On repeat, Googlebot indexes with the other version. Both desktop and mobile layouts of a site will be indexed as a result, with that indexing feeding into search results.
Mobile crawling and indexing
A couple of notes here about what the device types mean:
- Using a mobile bot does not mean that Google is using a mobile device to crawl and index sites.
- Googlebot uses a specific user agent string in their Chromium engine that will change the way a page renders to match the screen size of a mobile device.
- Any changes to performance of the crawler for either device emulation, such as bandwidth or CPU throttling, have not been made public.
The shift to mobile-first indexing makes sense in the context of current traffic patterns online. In March 2020, mobile phones accounted for over half of web page visits in the U.S. Mobile-first indexing collects information on the structure, layout, and content of a site when it is rendered on a screen the size of a mobile device.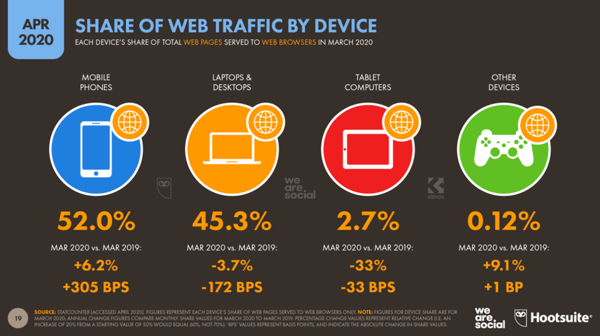
Tweaking search ranking
Once a site is indexed, that information gets fed into Google’s search results ranking algorithms. The algorithms are refined further through user testing. Google uses what they call Search Quality Raters to determine the quality of results that are returned through current or proposed algorithms. From there, they make changes to the algorithms as needed.
How do performance + experience influence search results?
From Google’s announcements of updates, we know that:
- Non-performant mobile sites are negatively affected in rankings.
- Mobile site structure is now important for indexing.
- Core Web Vitals will soon factor into search rankings, likely in the coming year.
However, what Google hasn’t made clear is exactly how these factors are being measured. The mobile version of Googlebot takes care of the indexing, but the source of site performance measurements has not been made public.
Google Webmaster Trends Analyst at Google, Gary Illyes, confirmed via Tweet back in 2017 that Googlebot, at that time at least, was not responsible for measuring performance of sites. He also recommended that developers follow guidelines published in Google’s Page Speed Insights to optimize a site for performance.
 Armed with this information, we can deduce a few things:
- A different tool, or maybe multiple tools are responsible for measuring site performance.
- The metrics used by PageSpeed Insights are the important ones to focus on.
This reasoning makes sense based on the updates that have been made to PageSpeed Insights since 2017. In 2018, PSI started using Lighthouse as its performance engine. More recently, the background information on PSI has been updated to reflect:
- The importance of real-world measurements
- A focus on the Core Web Vitals project that Google announced in May 2020
By understanding the real-world measurements and these Web Vitals metrics, we can speculate how they impact Google's ranking algorithms and affect search results.
What goes into measuring performance + experience?
PageSpeed Insights, Lighthouse, and other web performance measurement tools were created for measuring what Google thinks is important to user experience on the Internet. Google has updated information provided by these tools to reflect the priorities of Core Web Vitals. The Core Web Vitals are comprised of 3 key performance metrics:
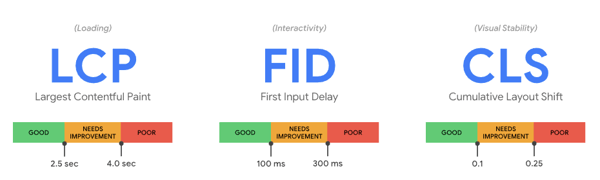
- Largest Contentful Paint measures the point when the largest paint on a page occurs.
- A good LCP happens 2.5 seconds or less in the page load
- A poor LCP happens later than 4 seconds in
- First Input Delay measures how quickly a page becomes interactive once a user inputs an action on the page.
- A good FID is 100 milliseconds or less
- A poor FID is over 300 milliseconds
- Cumulative Layout Shift is a score that measures the visual stability of a page.
- A good FID score is 0.1 or less
- A poor FID score is over 0.25
You might notice that these performance metrics are related to user experience outcomes on a page. Basically, Google is approximating user experience with their new performance metrics. There are additional performance metrics tracked by the Web Vitals program that can be related to experience as well, but LCP, FID, and CLS are the 3 that comprise Core Web Vitals.
When measured in real-user data, scores for each metric should be calculated at the 75th percentile of all users. When measured in synthetic data or from a single browser, scores for each metric are calculated using mobile emulation with a certain level of throttling in order to emulate “fast 3G” conditions.
So does Google use real-user performance or synthetic performance?
>Google calls real-user information “>f>ield >d>ata.” Anything measured synthetically or on a single browser is called “>l>ab >da>ta.” Google gathers both field data and lab data for the >Core Web Vitals.>
>Field data
Google collects field data directly using their Chrome browser. They can measure real-user performance when u>sers are on a Chrome browser and they:
- Opt into syncing browsing data
- Have not created a sync password
- Have not disabled sharing usage statistics
If all conditions are true for a user, Google collects the performance information associated with each page a user loads. The data is then aggregated and anonymized by Google for use in a tool they call the Chrome User Experience Report, or CrUX Report.
Data from the CrUX Report is available in PageSpeed Insights. As such, it is possible that the CrUX data is used by Google in its search results ranking algorithms. Although this has not been confirmed officially in documentation, John Mueller, a Senior Webmaster Trends Analyst at Google, shed some light on the issue in 2018. In a Google Webmaster Central Hangout [at 15m 30s, in German], Mueller confirmed CrUX data is part of the way Google measures performance.
Lab data
One of the metrics in Core Web Vitals, First Input Delay, can only be measured in real-user data where users are interacting with the page. To replicate FID in lab data, Google suggests using the metric Total Blocking Time to give an approximation of real-user experience. Because of this, tools like Lighthouse and PageSpeed Insights will report on TBT as a larger contributor to the performance score.
These scores always use lab data. If Googlebot were to run Lighthouse audits against indexed sites, the resulting data would also be lab data.
Field data is likely, but lab performance is possible
The possibility that Google is using data from the Chrome User Experience Report through the lens of the Core Web Vitals is very high. This data is extensive, plus it has been confirmed by John Mueller from Google. But he has also stated that the CrUX report is not the entire story of how Google gathers performance data.
It is also possible that a change was made since 2017 to the Web Rendering Service that Googlebot uses that allows it to measure performance of sites, or some other synthetic or real-user method of gathering performance information. Both sources of performance data are possible, but the reality is that not enough information has been released to be certain of Google's methodology for measuring performance.
We know that the Core Web Vitals metrics are going to become very important to the performance of sites sometime within the coming year, and that poor performance does negatively impact search rankings. Google has also stated that, while content is the main determining factor in rankings, ranking two sites with equally effective content will be determined by performance.
What are the limitations of using Google’s recommended tools?
The limitations of Google’s tools comes down to the limitations on the kinds of data being collected as well as the methodologies used to collect data.
Chrome User Experience Report limitations
CrUX data, while extensive, will limit real-user results to just a subset of Chrome users. Because of that, Google recommends additional real-user monitoring to get an idea of real-world results for the Core Web Vitals on your website.
In the US over the last 12 months, Chrome comprised about 37% of mobile page views and 59% of desktop page views, with 47% share overall. While still an enormous sample size, this is less than half of traffic, and even less for mobile users. While CrUX data provides good benchmarking for this specific subset over time, it does not necessarily reflect the reality of the average or median experience on your site.
While use of an real-user monitoring tool on your site is easy, it is unlikely that Google will ever be able to improve the diversity of their reference data for performance. The lack of diversity for their purposes is not necessarily a problem, since they are providing a valuable service to sites across the Internet. However, it does introduce a positive feedback loop by basing optimal experience of Google Search in the Google Chrome browser.
Lighthouse limitations
When running an audit using any of the tools mentioned earlier, it is considered a lab measurement using the Lighthouse engine. While these audits will provide you with general ideas on performance guidelines, the accuracy here is limited. Google provides documentation on potential variability when running any Lighthouse measurement, and what kinds of variability their throttling methodology will and will not mitigate. Using the Lighthouse CI on a dedicated machine is likely the most precise way to control variability.
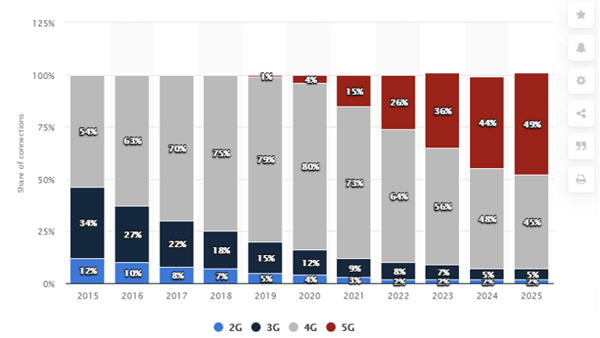
Additionally, the throttling methodology does not follow the current state of mobile conditions on the web. While Lighthouse is currently configured to emulate a Moto G7 device in fast 3G conditions, in 2020 in North America, 84% of mobile traffic is either 4G or 5G, projected to increase to 97% in the next five years.
Another challenge with Lighthouse is that mobile results are simulated through extrapolation from desktop measurements in most cases, apart from specific synthetic measurement service providers. Simulated throttling through desktop results will always be less accurate than a measurement throttled through mobile emulation when other conditions are equal.
Finally, while synthetic data, or lab data, is useful for providing consistency in benchmarks, it does not necessarily reflect real-user experience of your site. Since Google has said the field data they gather in CrUX factors into their performance data collection, real-user monitoring should be used in tandem with any Lighthouse benchmarks.
How do I make the most of all this information?
To recap some of the key points from this article, we learned that:
- Core Web Vitals reflect the importance of user experience, and they will be used more extensively in 2021 for the performance portion of search results rankings.
- The Chrome User Experience Report (CrUX Report) uses limited real-user data while Lighthouse and PageSpeed Insights use synthetic or lab data for scoring.
- The CrUX Report data accounts for part of the performance data Google uses in its algorithm.
- Web Vitals provides documentation for performance reporting in CrUX, Lighthouse, and PageSpeed Insights.
- Core Web Vitals in real-user data include Largest Contentful Paint, First Input Delay, and Cumulative Layout Shift, and FID is replaced with Total Blocking Time whenever synthetic or lab data is used.
Using Lighthouse and CrUX data within their limits
However, we know that all these tools have some limitations. CrUX data and Lighthouse data, both provided in PageSpeed Insights, provide a good benchmark for your site in terms of Google’s performance data collection for their search engine algorithms.
For consistent lab results, use the Lighthouse CI on a dedicated machine during maintenance and before releases. The forward-looking focus here should be on user experience, measured with the experience-centric metrics provided by the Web Vitals project. Using CrUX data as a benchmark is useful as well, but with applicability just to a subset of your Chrome users.
Using holistic real-user and synthetic monitoring
Holistic user experience is directly measurable through a real user monitoring tool like Blue Triangle. Real user monitoring allows you to:
- See the performance and resulting user behavior for every page of your site
- Filter different dimensions of that data such as geography, device type, A/B testing segment, and more.
Synthetic monitoring works with real user monitoring to give a holistic view of your site. With synthetic measurements, you can:
- Configure the exact same throttling conditions as Lighthouse, but in real-browser measurement using mobile emulation.
- Script key portions of your site to monitor, test, and measure critical flows on an automated basis.
- Alert on changes, create reports based on Google’s standard 28-day baseline, or set your own baselines for reporting and alerting.
With reporting pulled from the APIs of these Google tools as well, you would be set both to benchmark your Lighthouse performance and create your own performance targets for your site based on real-world measurements. Blue Triangle has these features and many more, so let us know if you have any questions about what we can offer!"
.png)

.png)