Internet Retailer Has Selected Blue Triangle as Its Web Performance Data Provider. Here's Why You Should Care.
If you work for an eCommerce retailer or are a solution provider in the eCommerce space, you've no doubt read a news article or kept up-to-date on the latest eCommerce trends with Internet Retailer. They also produce the largest eCommerce conference in the world - IRCE.
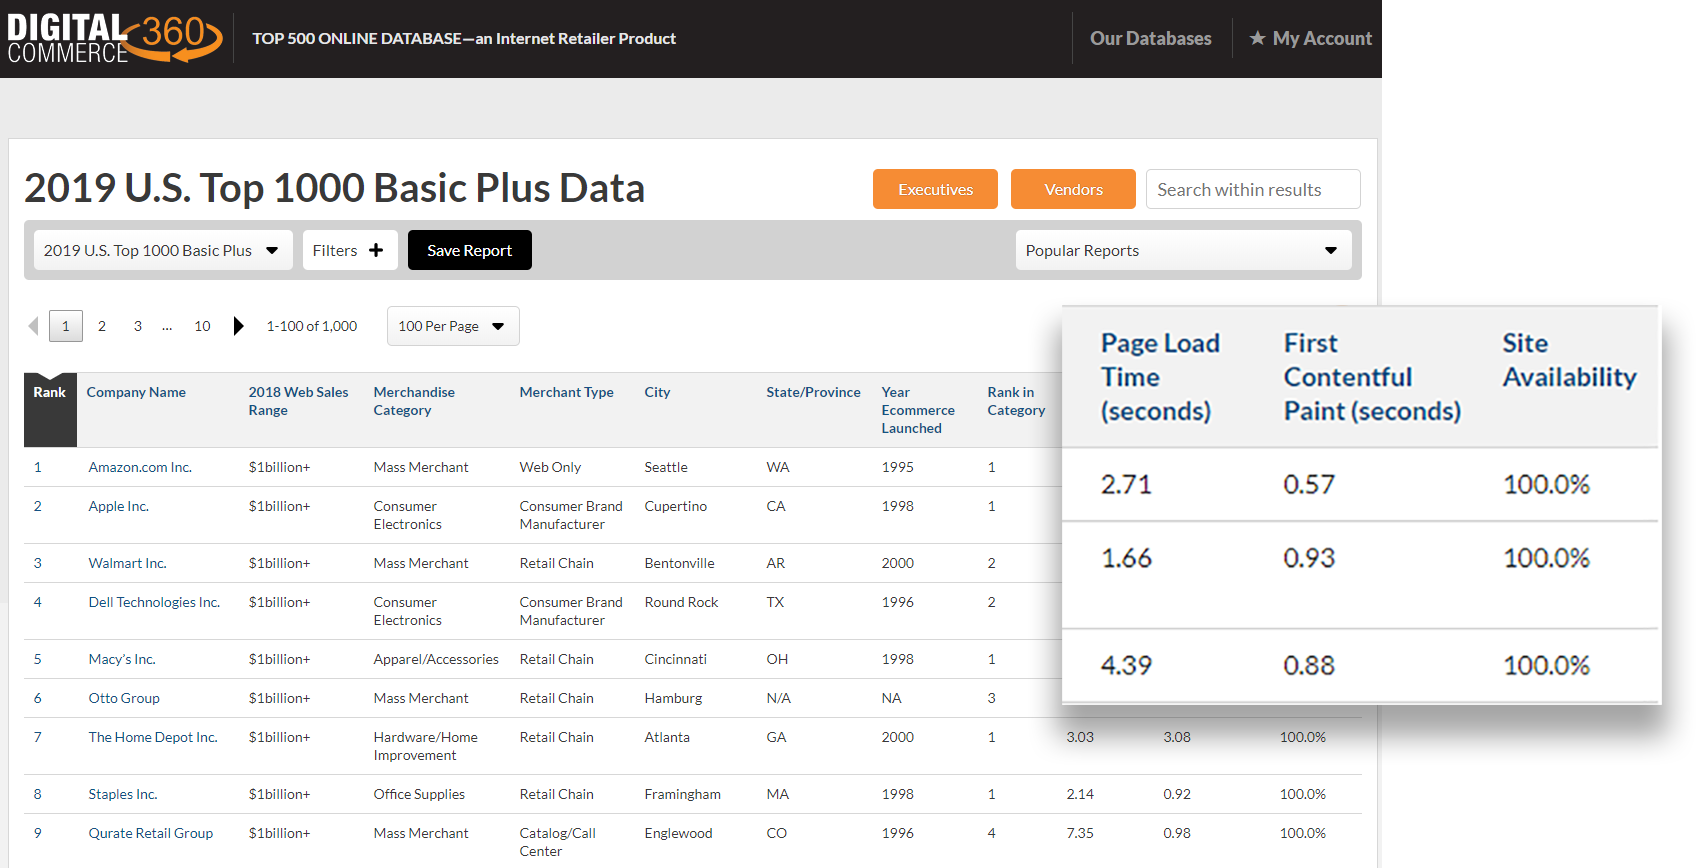
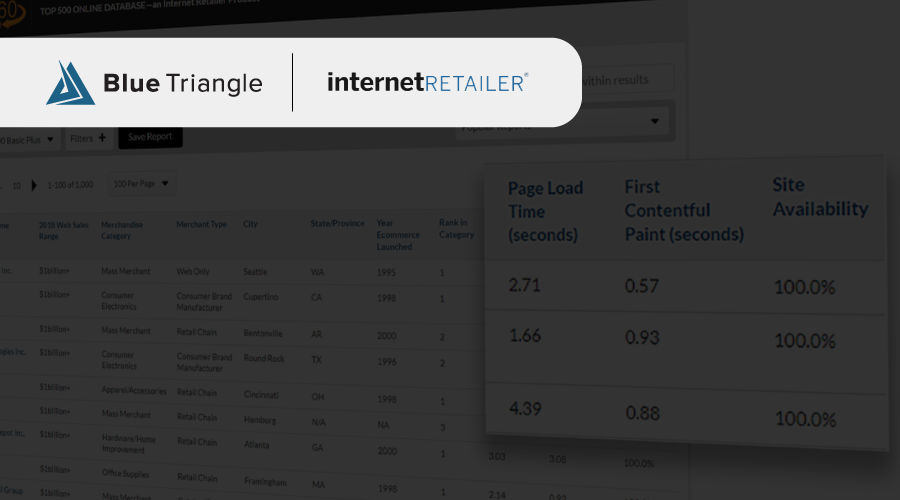
As Internet Retailer looks to expand its industry expertise and address the business benefit of having a fast and reliable eCommerce website, they have selected Blue Triangle as their web performance data provider. This partnership comes to life in their new 2019 Top 1000 Database, where we provided them with these web performance metrics for over 3,000 different eCommerce websites.
Here are the Blue Triangle metrics you'll find in the 2019 Top 1000 Database:
Page Load Time
The time it takes to download and display an entire web page.
First Contentful Paint
The time it takes for the first piece of text, image, canvas, or SVG to be painted on a web page.
Site Availability
How often a website is up and running.
If you'd like to stay up-to-date on how these retailers stack up against each other, check out our Retail Industry Benchmarks.
Why You Should Care: Web Performance Matters
Internet Retailer has defined 14 categories within the Top 1000. When we do the math, there are on average 71 sites per category. So if your website is slow and your customers leave, your customers are taking their money to one of your 70 competitors. In eCommerce, patience is not a virtue.
So how much does web performance impact your bottom line?
How Web Performance Impacts Your Bottom Line
- If Amazon slowed down by 0.1 seconds, they’d lose 1% of their revenue.
- Missguided reduced page load time by 4 seconds and saw a 26% increase in revenue.
- Bing saw a 2.8% drop in revenue for every 1 second of delay.
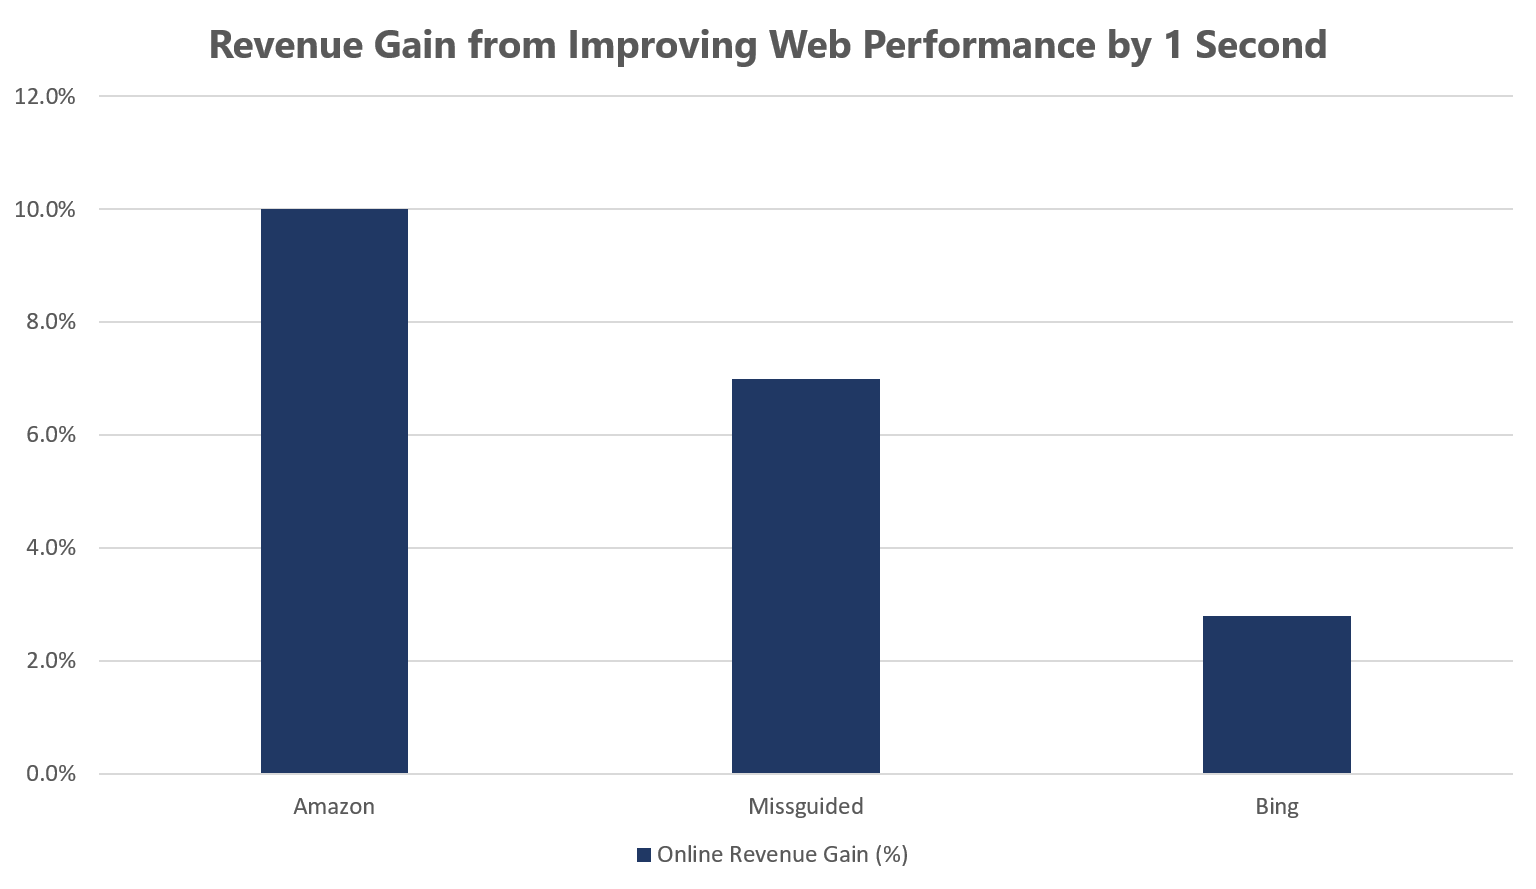
When we normalize these numbers to a 1-second improvement, we find that every site has different results:
- Amazon: 1 second = 10% of revenue
- Missguided: 1 second = 7% of revenue
- Bing: 1 second = 2.8% of revenue
How to Build Your Web Performance Business Case
These studies illustrate the benefit of improving web performance, but given the variance in results, you cannot rely on them to build a solid business case. Plus, speeding up your entire site is no easy task, and it certainly isn't cheap.
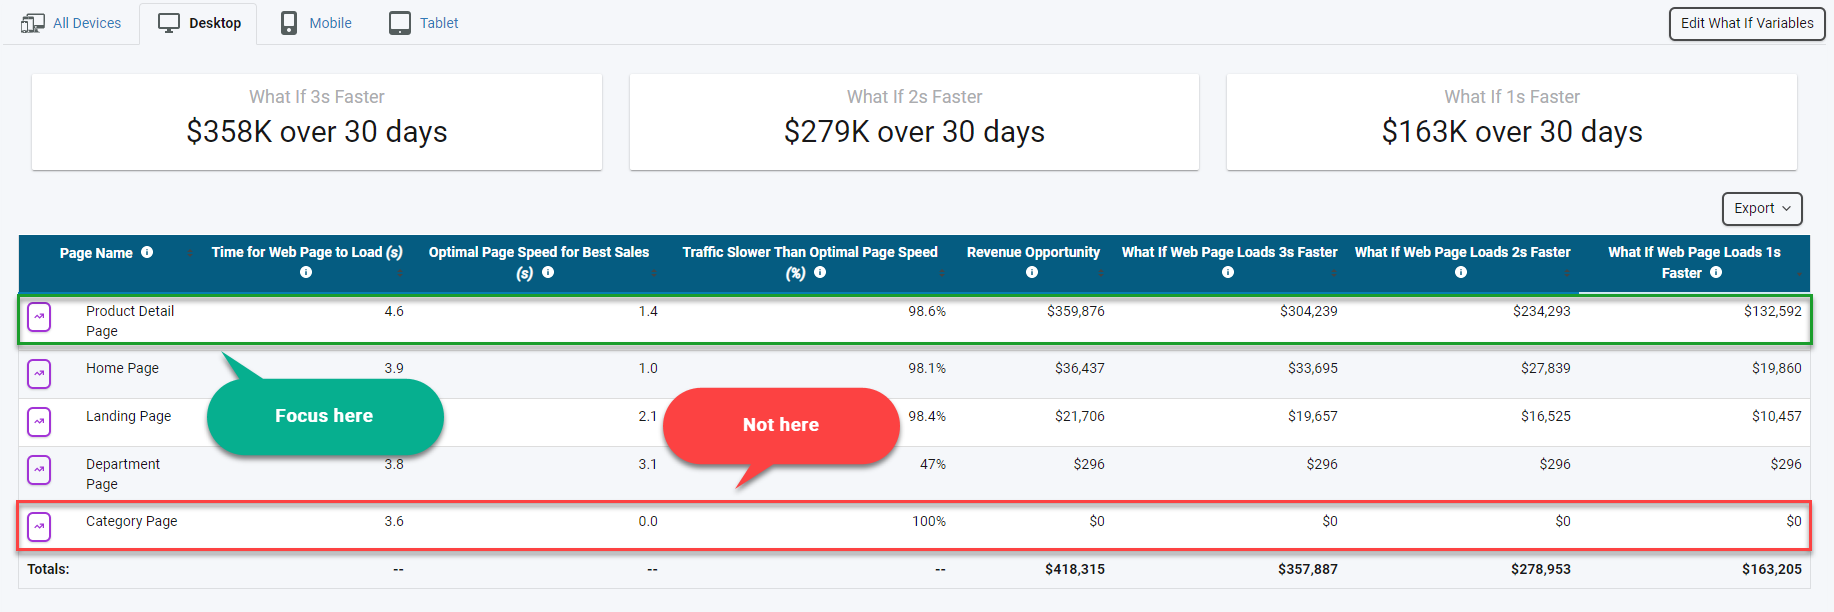
You need to correlate your web performance to your revenue on each of your web pages so you can 1) calculate your ROI, and 2) prioritize development based on revenue impact. Then repeat this process for every device type.
For one Apparel retailer, Blue Triangle found that speeding up the Product Detail Page for desktop users by 1 second would generate $132,592 in additional revenue per week, whereas speeding up the Category Page for the same user-base would have no revenue impact. Don't waste time and resources addressing the wrong areas of your site.
Now that you're prioritized, you can get to work. Our Accelerator Blog Series is an excellent place to start. And our Real User Monitoring can find what's slowing you down.
Trust the Experts
Since 2011, we've been monitoring web performance and correlating web performance to business metrics like conversion rate, revenue, pages per session, etc. That means we've had 8+ years to fine-tune our algorithm while working with eCommerce behemoths like Marriott, Kohl's, and Lenovo. So when we show you what pages to focus on first and calculate the dollar-value impact, you'll have confidence your development team is pointed in the right direction.
Ready to prioritize optimizations, improve web performance, and grow your revenue?
During the holiday rush, every shopper matters
Optimize the customer journey before the eCommerce event of the year.

.jpg)
