Why is a frictionless user experience necessary in mobile app development?
When users visit your app, you have only a few moments to win their trust and convert them into customers. A high-performing, well-designed app can attract more users, boost customer loyalty, and directly lead to business success, such as improved conversion rates and increased revenue.
For these reasons, native mobile apps are a game-changing digital strategy for every retailer and consumer-facing vendor, making the need for mobile user experience investment a no-brainer.
According to Business of Apps:
- The US app market generated $44.9 billion in 2023 (and is expected to surpass $567 billion by 2030)
- 12.5 billion apps were downloaded in the United States in 2023
- Smartphone users spent 217 billion hours on mobile apps last year.
While mobile apps can unlock tremendous potential, it can be challenging for mobile app owners (such as developers and business leaders) to deliver on user expectations.
On the one hand, mobile experiences are very dependent on network quality, the level of load on the device resources (computing, storage, etc.), and other factors that can introduce friction in their journey. At the same time, users are susceptible to sub-optimal experiences and, when unable to complete a desired action due to friction, can abandon your app for a competitor.
Unsurprisingly, decision-makers in such companies struggle to find the answer to where to invest – in the next feature or frictionless experience? Specifically, even while recognizing the importance of delivering a frictionless mobile app experience, how do you build a business case for that investment?
3 ways to build a business case for a frictionless mobile app experience
Whether your business outcome objective is revenue, session conversions, etc., Blue Triangle offers unique business intelligence insights that demonstrate the impact of friction on the user experience. 100% of all real user sessions are captured and presented through user journeys, sessions, session conversion, and other views as a parameter of timing performance and errors.
1. Mobile Native App Customer Journey
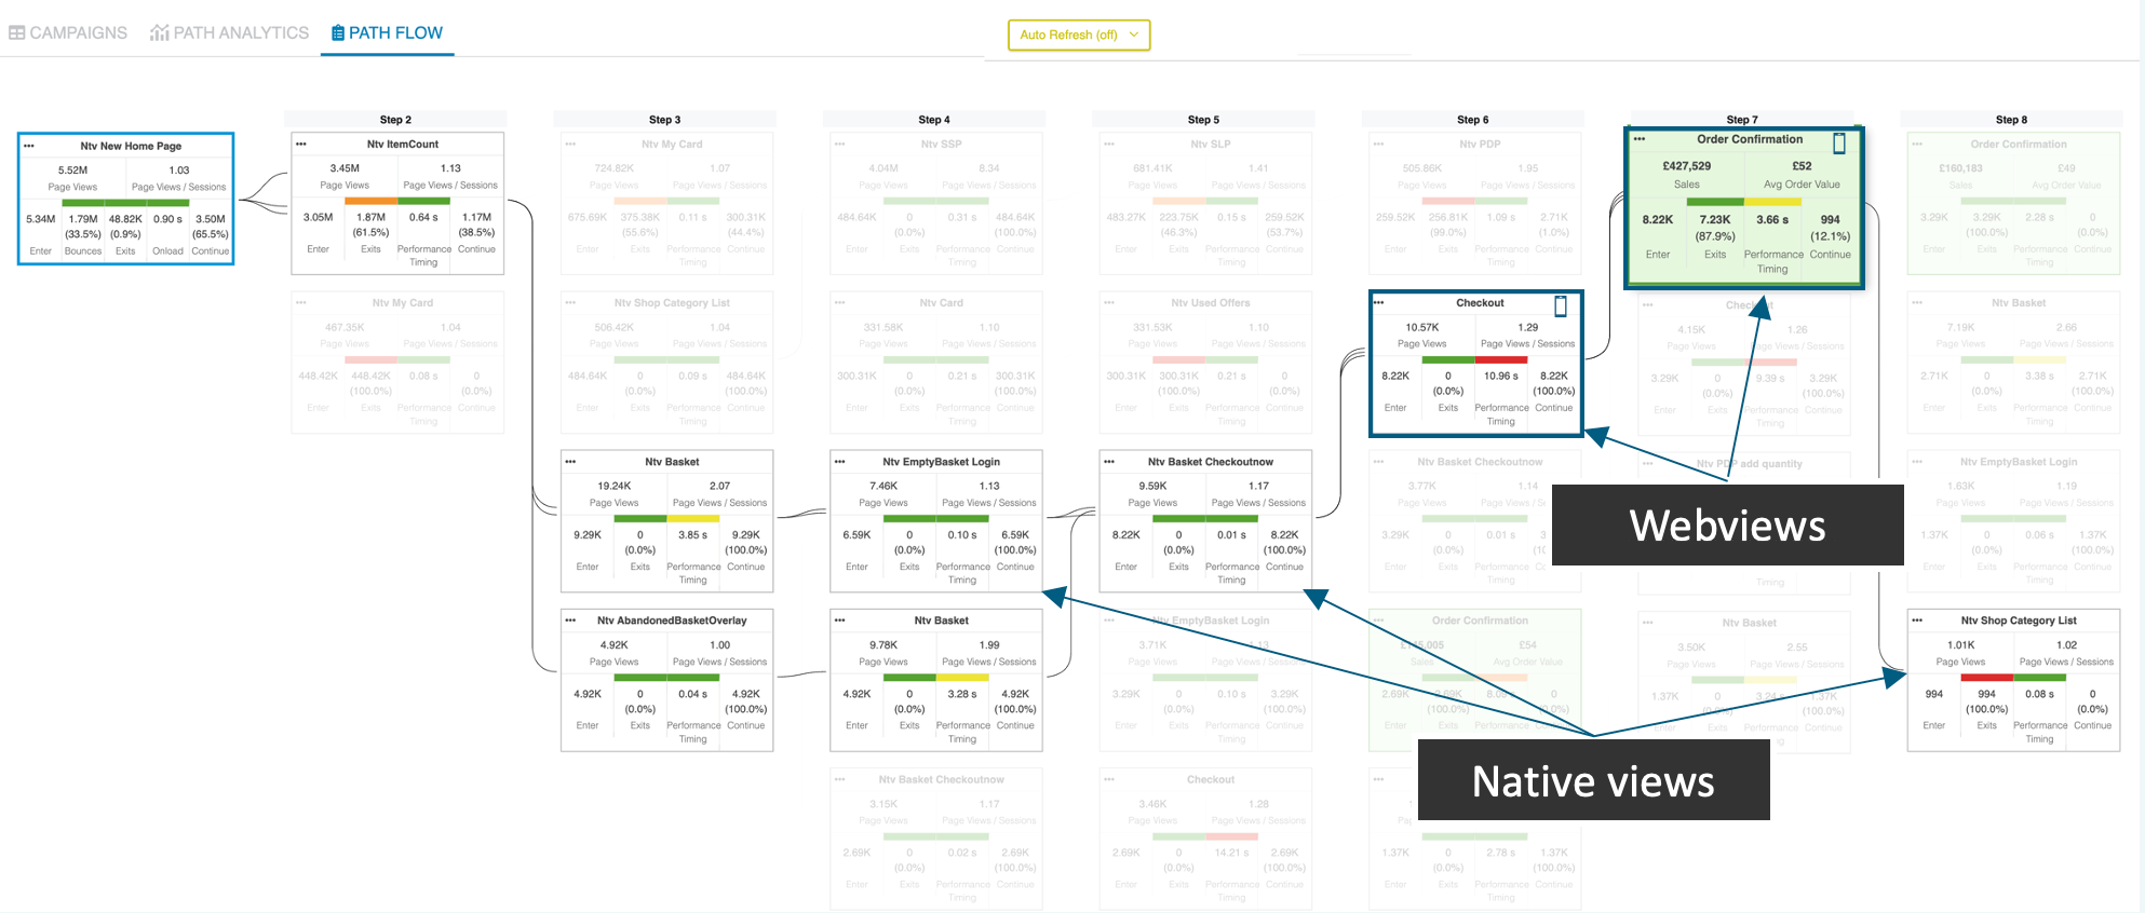
With mobile native app customer journeys, for example, a decision maker can view the connection between native views and webviews, identify friction-filled pages that fracture the user flow, and prioritize fixing the pages to optimize that journey.
2. Conversion Rate Curve
Another method to build the case for a frictionless mobile app experience is leveraging the conversion rate curve, where a decision-maker can assess the impact of mobile view timing on session conversion and revenue.
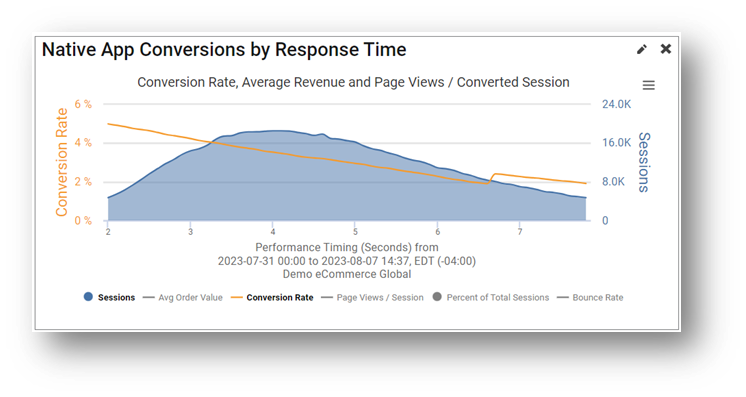
Using a conversion rate curve, a decision maker can assess and invest in performance timing to move an underperforming segment of the user population to a higher converting area, as measured by time (i.e., going from 6 seconds to 5 seconds, and thus providing a better user experience leading to a higher conversion rate).
3. Revenue Opportunity and ROI Validation
As a last example, you can go from guessing how much friction points cost to knowing the real business impact based on untapped data from your customers' experiences.
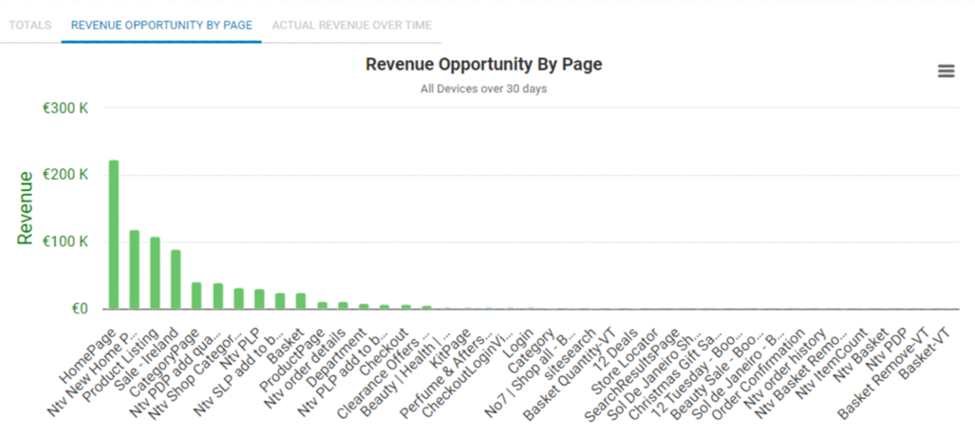
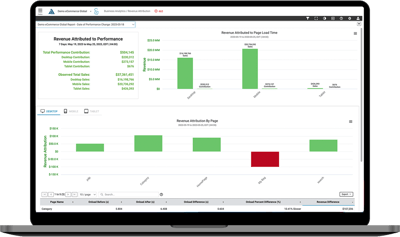 By quantifying the conversion and revenue loss due to unresolved friction, you can then:
- Replace hunches with proof points by validating that your friction remediation efforts achieved or exceeded the expected outcomes.
- Determine if further remediation is required.
- Prove the ROI of every optimization made to your app.
3 critical questions to ask when building a mobile app business case
The questions to be answered in every one of the above methods are:- Which friction points can be resolved to achieve my business goals?
- What optimizations are going to be most impactful?
- Finally, can you prove the ROI of your frictionless experience investment?
How to Identify Mobile App Friction and Optimize the Mobile User Experience
Here are a few common mobile app friction points impacting the user experience and your business outcomes.
1. Network traffic
Starting with network traffic, a user might want to examine the network interaction through a waterfall chart, the performance of various domains, etc.
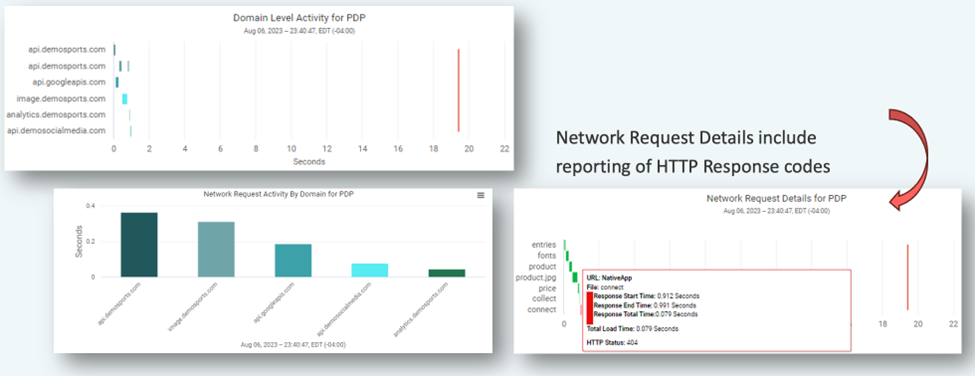
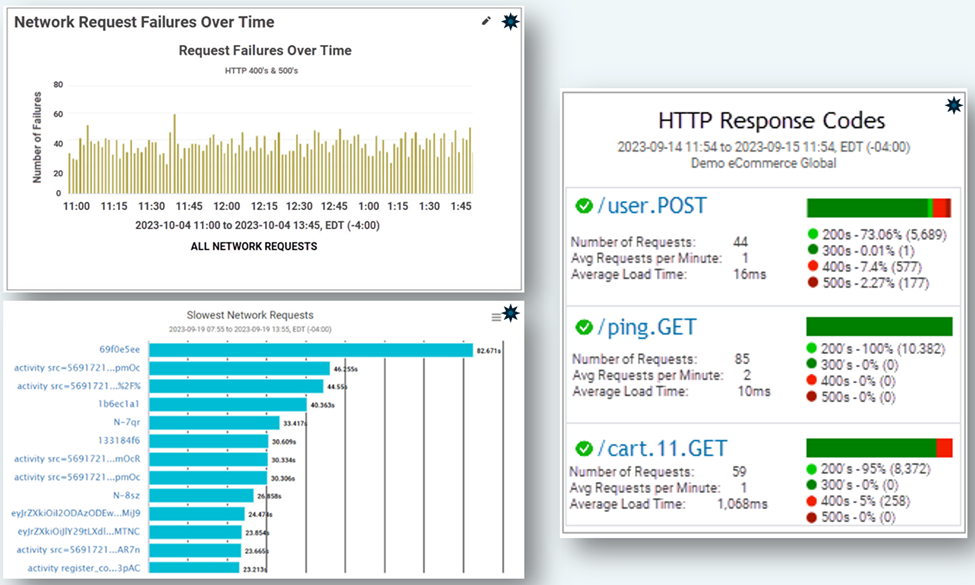
The aggregate waterfall chart is a valuable tool for analyzing network traffic over time and deciding if elements are consistently delayed, which justifies optimization. As seen below, another set of widgets would provide deeper insights into slow performance and network failures.
2. Errors and Crashes
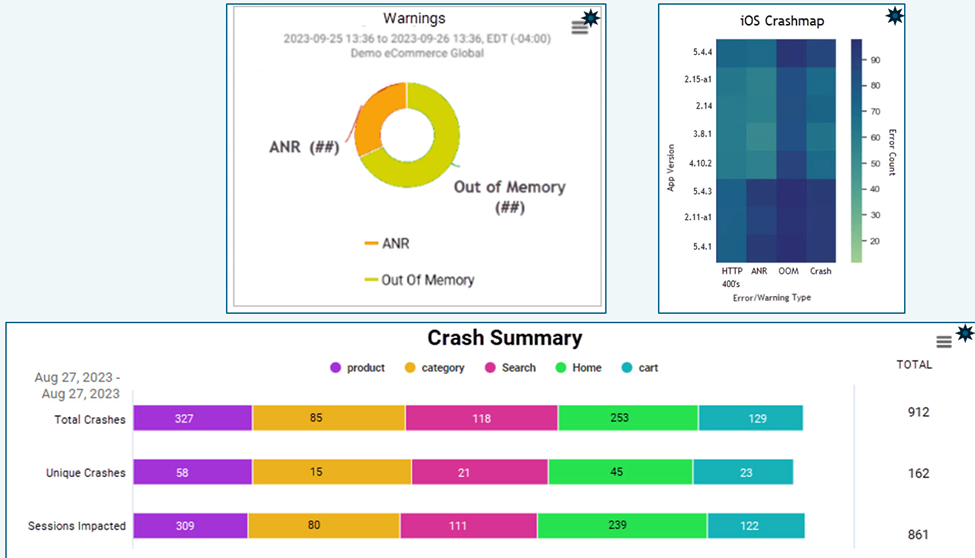
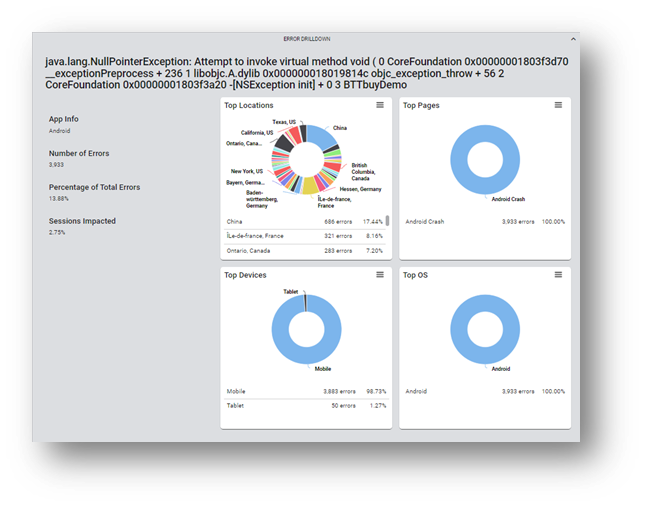
Naturally, errors and crashes can severely cause users to be unhappy. Blue Triangle offers a wide array of visualizations about such insights.
Errors and crashes can be viewed by locations, app versions, and OS.
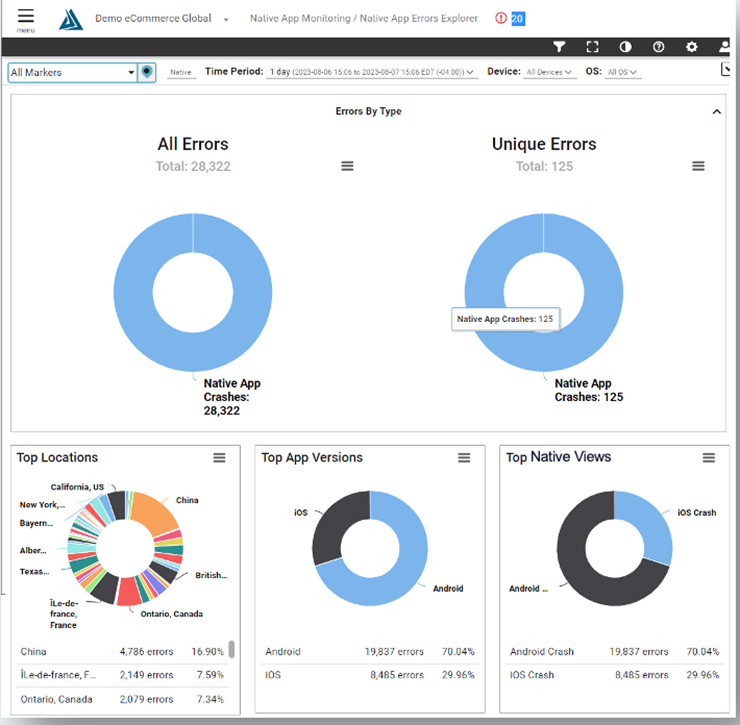
Furthermore, a user can view the crash summary or the crash/error details.
3. Hybrid Application Support
Most mobile applications include a web component in them, usually referred to as "web view." The genesis of such an offering is that some pages are already built using web technology, and it is in the organization's best interest to leverage those as part of the mobile application. Naturally, those pages are designed to render on a mobile app and are an integral part of mobile strategy.
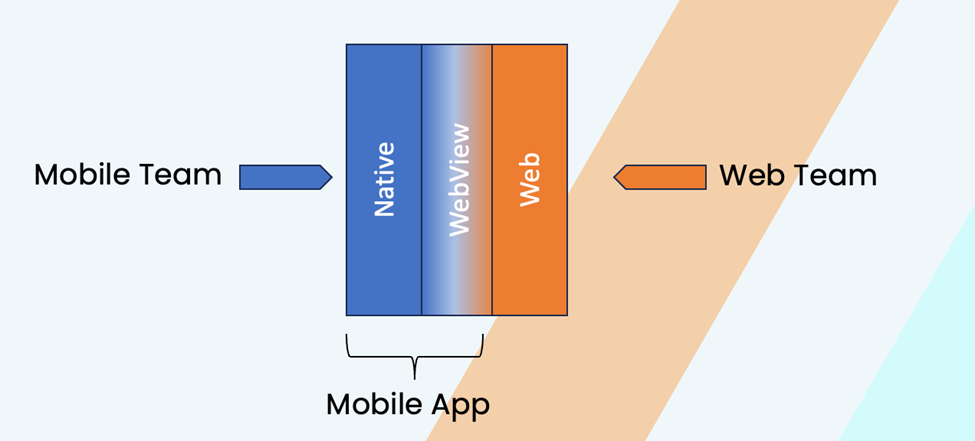
Support for hybrid applications is offered in the following 3 ways:
1. For decision-makers focused on business outcomes, the primary consideration is user sessions, including session conversions, session count, pages or views/session, etc.
In this sense, a user journey that began in a mobile application is considered a complete session and can include webview. Conversely, a user journey that started in a browser (mobile or web) is considered separately from an app user journey.
This is aimed at serving the mobile app business owner and the owner of the web experience.
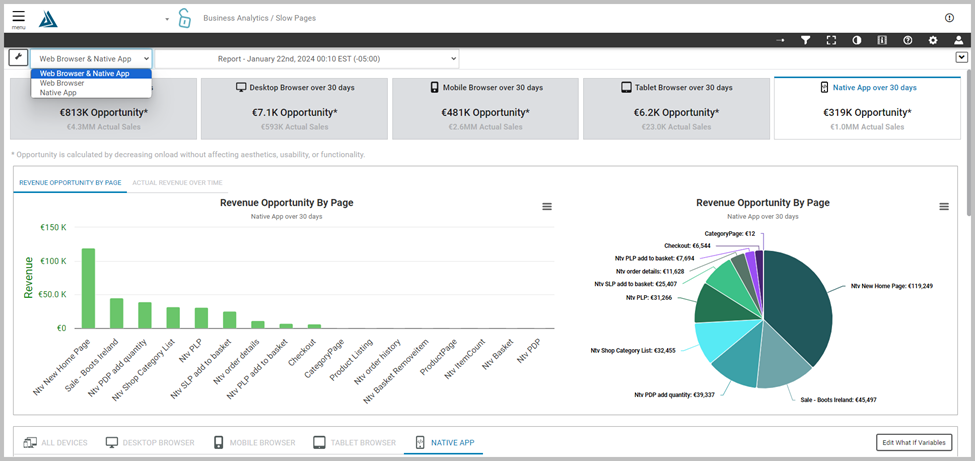
2. Mobile practitioners may want to examine and optimize native views. However, they may also want to review the behavior of web views inside their realm. Hence, in the mobile app analysis pages, users can review the mobile native views, the web views, or both.
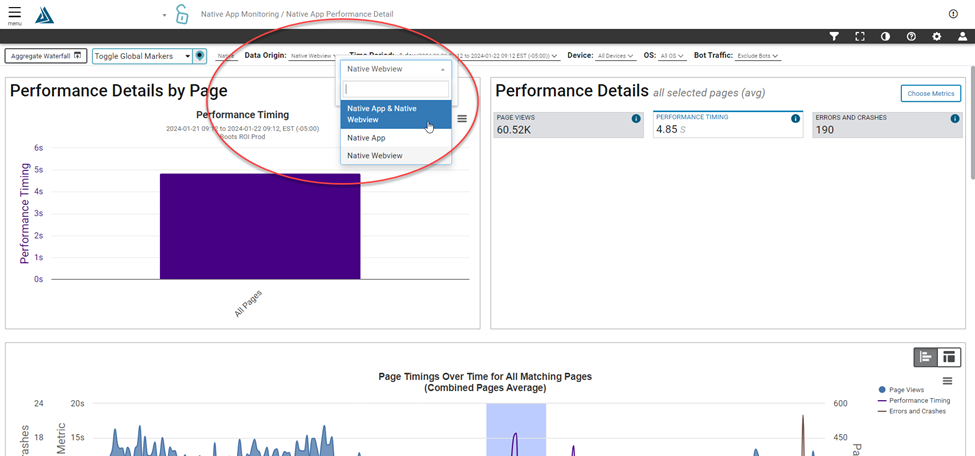
3. In correlation, web developers may want to work on web pages viewed through a browser or web views embedded inside a mobile app. Proper filtering is provided to offer those users a view into the browser pages, webviews, or both.
4. Analytics and session replay
In addition, performance practitioners, designers, and developers may be interested in viewing specific sessions through a replay of the user action to understand errors, crashes, etc. Through Blue Triangle integration with Microsoft Clarity, application owners can view analytics data, heatmaps, and session replays at no expense.
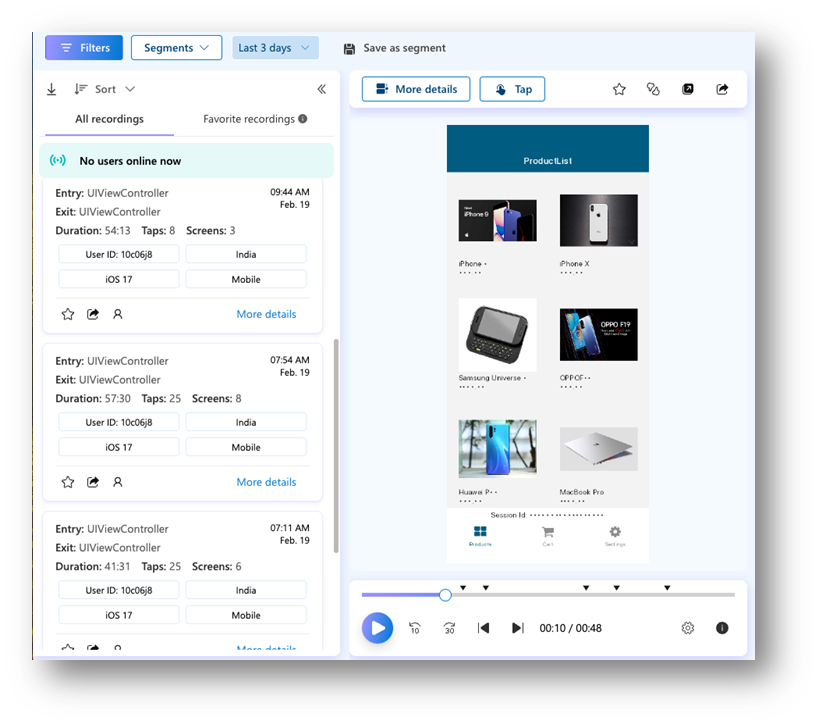
Learn more about how to integrate Blue Triangle with Microsoft Clarity.
Achieve a frictionless mobile app experience now.
Mobile native applications are essential more than ever for digital and omnichannel business success.
However, exclusive investment in features alone does not guarantee user adoption, loyalty, and the desired business outcome, such as greater revenue and conversions, that a mobile app can provide.
Blue Triangle now offers a differentiated suite of tools to quantify the user experience through a business impact lens so you can drill into the root causes of mobile app friction and resolve the ones costing you the most in lost conversions and revenue to deliver truly frictionless mobile app experiences.

During the holiday rush, every shopper matters
Optimize the customer journey before the eCommerce event of the year.

.jpg)
