What else can I do to optimize my site?
So you have optimized your images, cached your queries, and lazy loaded your page. But your load time and Time To Interactive are still slow. Now what? Our engineers and data analysts knew there was more to a page load, so we figured out a way to trace the JavaScript stack.
The modern web is built on JavaScript, and your site likely uses thousands of JavaScript functions in a single page load. JavaScript adds dynamism to web pages. Adding JavaScript to a site is easy, but it is hard to optimize.
Optimizing JavaScript is hard because you have to understand why it works the way it does, and you also need to know how long it takes to run on your page.
Wait, can you explain how JavaScript works?
One of the first things you learn as a Java Script developer is that JavaScript is single-threaded — each piece of code finishes executing before the next piece of code runs.
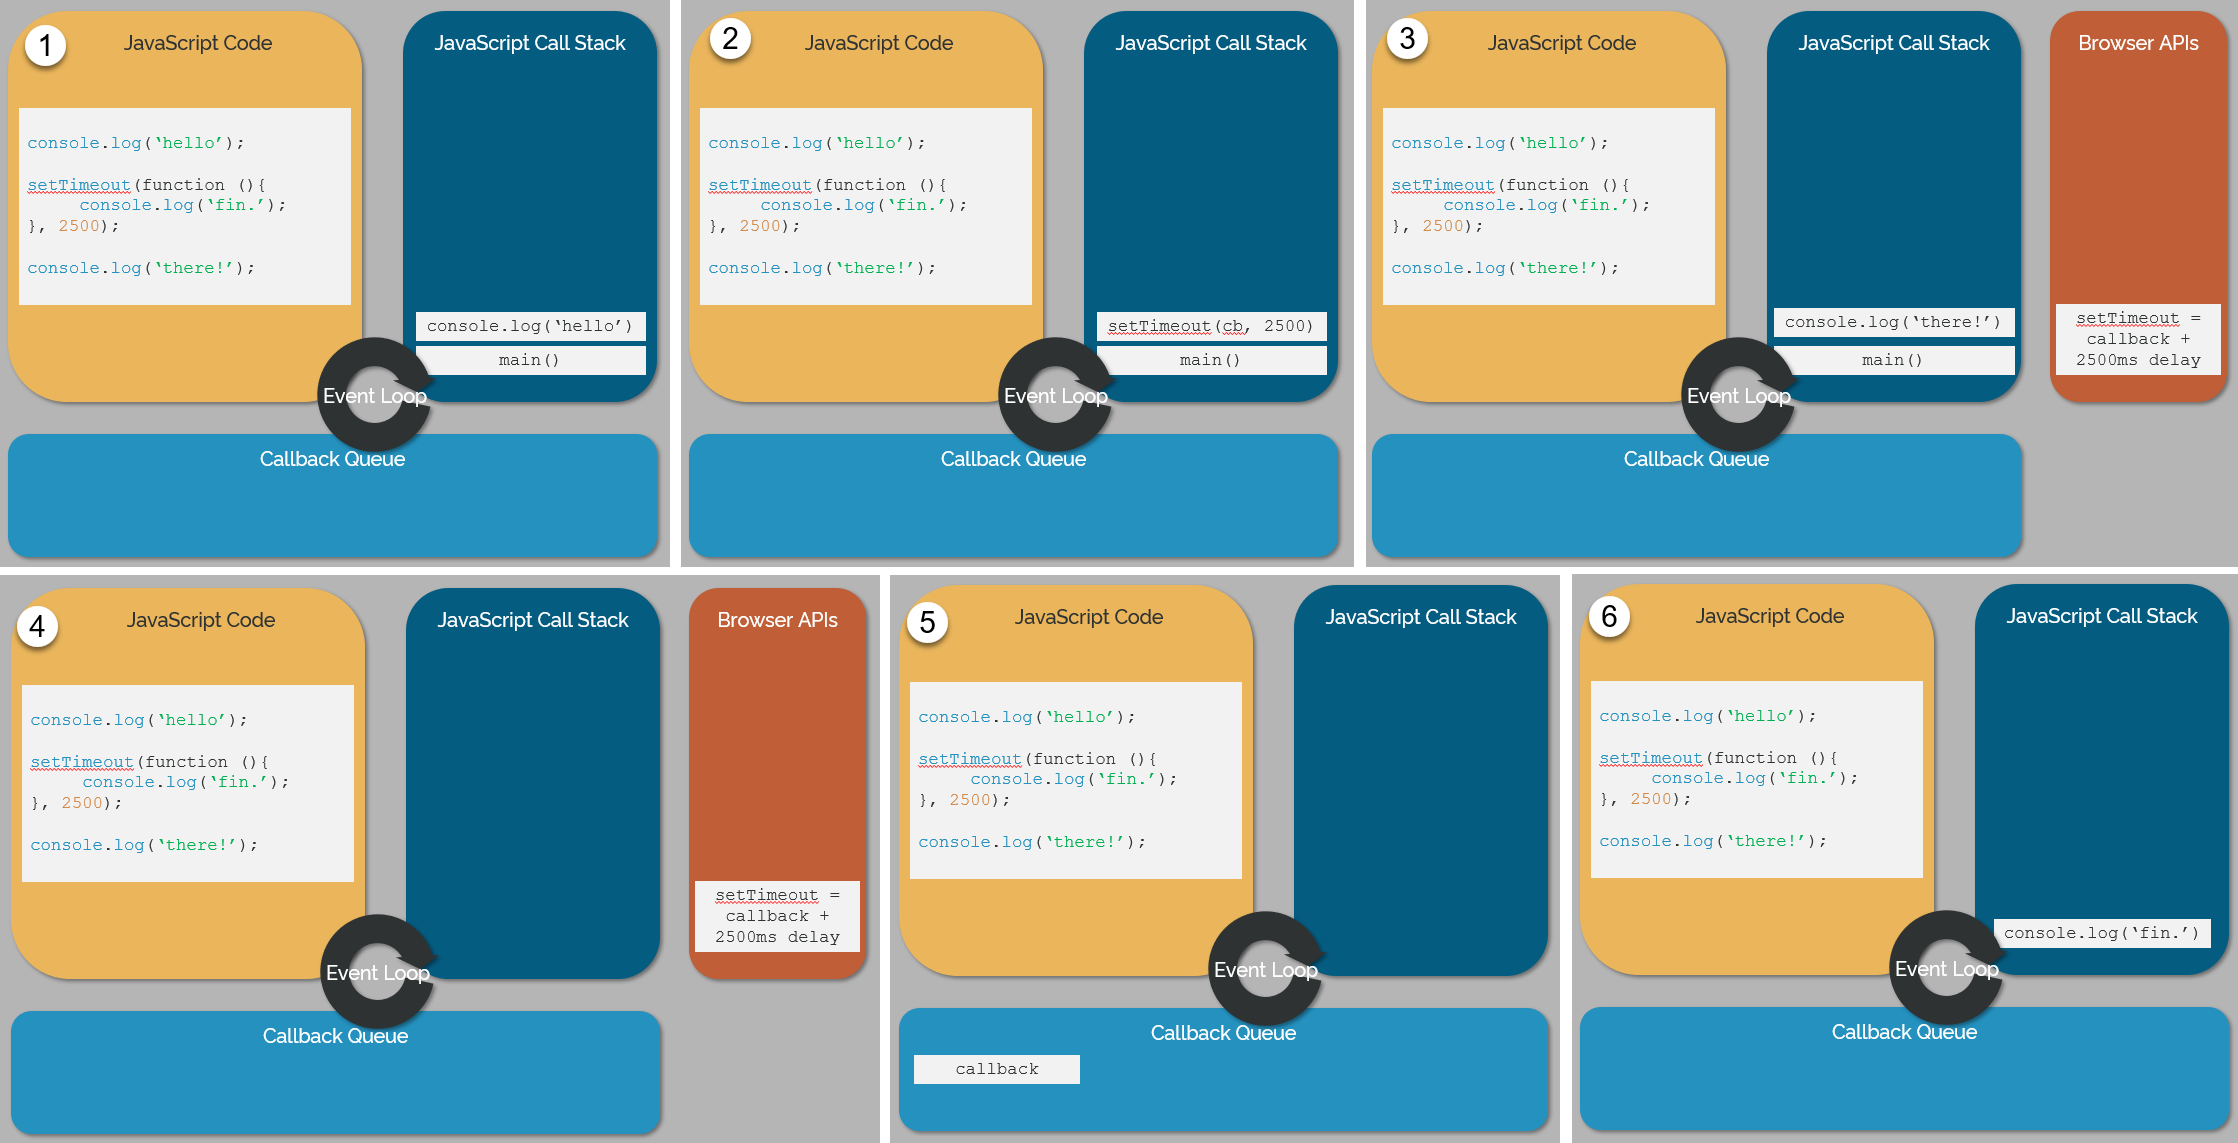
However, JavaScript has certain functions that allow code to execute later, after the browser sees it for the first time, which is called asynchronous execution. So how does JavaScript, which can only do one thing at a time, skip over some functions and then remember to come back to them?
Well, JavaScript execution is controlled by the browser, which has three parts that handle script execution. These parts follow a specific logic until the page is done processing, with all the processes that ran making up the JavaScript stack for the page. Together, these three components can handle any scripts that are used on a web page.
The three parts are:
- the call stack,
- the callback queue, and
- the event loop.
What is the call stack?
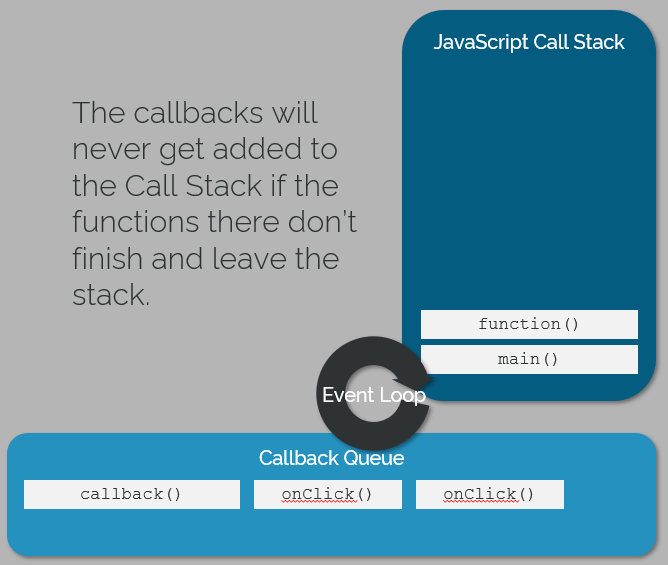
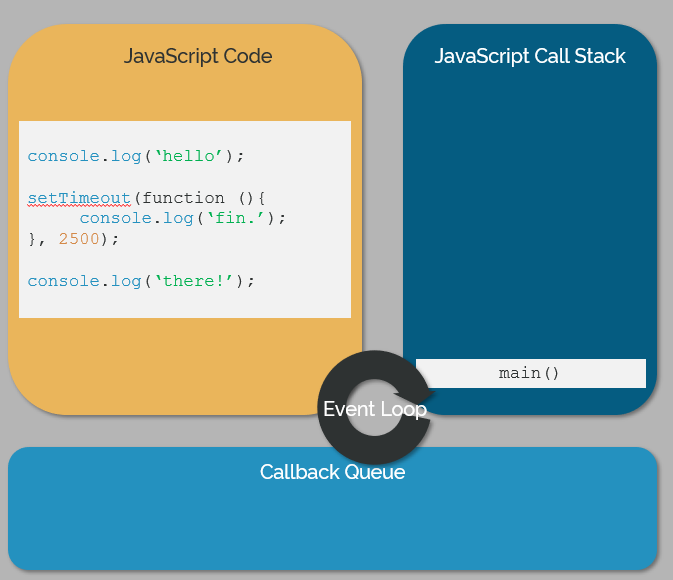
The browser looks in the call stack to find the next piece of JavaScript it needs to execute. Since JavaScript is single-threaded, the browser must empty the call stack before more functions can be added to it. This includes executing any nested functions and actions that happen inside of the original function added to the call stack. As each function finishes, it comes off the stack.

Then what’s the callback queue?
The callback queue is where functions and processes that are called, but not immediately executed, go to wait. Once the call stack is empty, the browser checks the callback queue for processes and functions that are now ready to run, and they get added to the call stack before more functions can be called. This is what makes JavaScript asynchronous.
So does the event loop really matter?
If you think about it, the call stack and the callback queue are storage components where JavaScript waits until it can run. But the browser isn’t figuring out how to communicate between the two spaces on the fly. That’s where the event loop comes in.
The event loop is the messenger between the different components that keeps everything running smoothly. It places functions on the top of the call stack and places each asynchronous action in those functions into the callback queue. Not only that, it handles the execution of functions and processes, too.

I get it. But what does Java Script execution have to do with making my page slow?
There are three simple reasons JavaScript slows down a page:
- Functions that add many actions to the callback queue will take longer to execute.
- Any additional functions in the call stack must wait for the current function to finish executing before they can begin executing.
- Lastly, whenever the event loop executes the function at the top of the call stack, page rending and DOM manipulation stop until the event loop can pick up the changes when execution is complete.
For example, say you have a chat box that loads early on your page, but it takes a while for the JavaScript that loads it to execute. While the chat JavaScript is running, it will block other JavaScript from running, like when a user clicks a button to add something to their cart. In fact, the user might not be able to click or scroll until the page catches up and calculates the net output value of their input for display and rendering. This is considered poor user experience, called “jank” or “lag” in the industry.

But how do I know if a function is taking too long?
The question Blue Triangle engineers had to answer was how to detect long-running functions so that we and our customers could see where there might be problems with script execution. If we could find long-running tasks on a user’s page load, we could take actions to make them asynchronous, reduce their complexity, or move the function further down the stack to keep it from blocking critical functionality. Blue Triangle’s function tracing feature taps into the Java Script stack and records the timings for every function that gets added to the call stack. We use a waterfall graph to represent the duration and order of each function. We also plot key stages of the page load, like Time To Interactive, to see exactly what functions might be affecting your users’ experience or keeping your page from having the load time you’re targeting.

How can I tell if it’s a persistent issue?
We also store functions performance over time and aggregate the data. Looking at function performance across a week or month can help you figure out which functions are consistently under-performing.
Not only that, but you can chart your progress making the page faster as you tweak your functions, create AB segments for pages that load your functions differently, and a plethora of other performance monitoring features included in Blue Triangle’s synthetic monitoring package.
At the end of the day, we let you make more informed choices for improving your site in a way that is meaningful to your users. Let us know if we can help.

During the holiday rush, every shopper matters
Optimize the customer journey before the eCommerce event of the year.

.jpg)

