.svg)

Blue Triangle is like having a Chief Conversion Rate Officer on speed dial. So you can get answers to the questions you should be asking to quantify and resolve costly friction.
TL;DR Watch this video to crack the code on how to prove the business value of your friction-removal efforts.
Navigating the often murky waters of digital friction and customer experience can be daunting. After all, a website or mobile app can be riddled with hundreds or thousands of friction points, resulting in a loss of conversions, revenue, trust, and loyalty.
Each revenue-robbing friction point presents an opportunity to improve the digital experience and business outcomes. But how do you decide where to start?
The answer is a Continuous Experience Optimization platform that shows exactly how much conversions, revenue, and sales you are losing due to unresolved friction in the customer journey.
What is Continuous Experience Optimization?
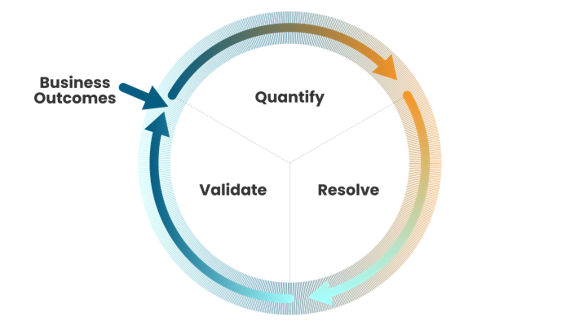
Continuous Experience Optimization is an iterative, 3-step approach that begins and ends with business outcomes to build better, frictionless digital experiences that delights and converts more users.
- First, quantifying the conversions and revenue loss resulting from digital friction.
- So you can then identify where to deploy resources based on impact to resolve friction.
- Lastly, validate outcomes achieved from your user experience optimizations.
Learn more about Continuous Experience Optimization.
Digital Friction is More than an Annoyance. It's a Silent Conversion Killer.
Your site or app is the front door to your business. And as the volume of online transactions continues to soar across every digital storefront, your customers are no longer only comparing their experience with you against your direct competitors. But rather against the best digital experience they've ever received.
The most successful companies have realized that the secret to capturing more untapped conversion and revenue opportunities and fostering customer trust and loyalty lies in ensuring a frictionless digital experience for every user.
Every company is focused on digital transformation and meeting customers where they are, which increasingly means transacting digitally with customers at every step in their journey.
But when site visitors or mobile app users encounter friction at any stage oftheir journey, they grow frustrated and often fail to convert. So, while brands may be investing millions of dollars to drive more traffic, many fail to capitalize on their existing traffic by delivering the frictionless experience consumers need to convert.
The Path to Building Unwavering Customer Trust and Loyalty Begins with Quantifying Friction.
Every website or mobile app interaction holds the potential to generate conversions and revenue. So, it's a no-brainer that every eCommerce team is equipped with a dashboard tracking conversion rates, revenue, and sales over time.
However, there's a blind spot. They fail to show the revenue loss due to unresolved friction.
Unresolved friction in the customer journey is hemorrhaging revenue unbeknownst to the team.
In fact, we uncovered more than $2.7 billion in conversion and revenue opportunity last year for some of the world's leading eCommerce brands by identfying friction in their customers' digital experience.

Read more about the shocking cost of unresolved friction and the financial and user experience benefits of delivering a frictionless experience, including increased conversion rates and greater average order value (AOV).
A revenue loss dashboard serves as a powerful tool for uncovering the hidden friction that disrupts the customer experience, costing you immediate conversions and long-term precious trust and loyalty.
Your team's arsenal of observability, session replay, and digital analytics tools might pinpoint where the red flags are waving, indicating friction points. But it's one thing to know that friction exists; it's another to understand and quantify its impact on conversions, revenue, and sales.
Why Blue Triangle?
With Blue Triangle, teams can leverage the untapped revenue opportunity from their existing site or app traffic by optimizing their customers' journeys, focusing on resolving the most significant sources of revenue loss.
Blue Triangle is the only platform that starts and ends with business outcomes, working with your existing tools to uncover hidden friction robbing you of conversions and revenue, and unifying all teams to deliver frictionless, optimized digital experiences.
And it's an ongoing process of Continuous Experience Optimization, ensuring that friction is minimized and revenue is maximized so you can:
- Increase conversion rates.
- Improve profitability and customer loyalty.
- Quantify and prevent conversion and revenue loss.
- Speed pages by blocking outdated, unauthorized, and risk-exposing third-party content.
- Drive more traffic by improving Google search rankings and SEO.
So, how exactly does it work?
Here are a few common Blue Triangle use cases and answers to the critical business questions that teams should ask about quantifying and resolving friction. Such as:
- How do we prioritize which friction points to fix?
- Where do users most often drop out of the customer journey?
- How do we find hidden friction on our site?
- What's causing poor Core Web Vitals scores?
- How much revenue did we recapture from resolving friction?
1. How do we prioritize which friction points to fix?
Problem: Angela, a Senior Vice President of eCommerce, raised concerns about their website's numerous slow pages. The challenge was prioritizing which pages needed fixing to avoid potential loss in revenue and conversions.
The team's existing observability platforms lacked the ability to connect page performance directly to business metrics, making it difficult to identify the most critical issues affecting their customer experience and bottom line.
Solution: By leveraging Blue Triangle's unique capabilities of quantifying friction, Angela's team can gain insights into the exact impact of friction, such as slow pages, on revenue and conversions. The platform provides customized conversion rate curves for each page, illustrating the potential gains in revenue or conversions by improving site experience by varying times.
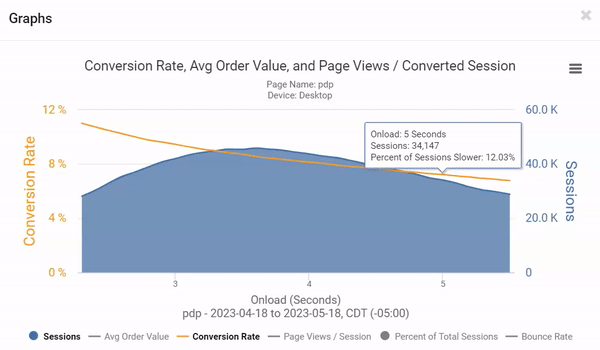
Quantifying friction allows the team to prioritize resources effectively, focusing on fixing the friction points that are not only detrimental to the customer experience but costing the most in lost conversions and revenue.
This strategic focus on addressing high-impact friction points improves the user experience and maximizes revenue potential, demonstrating a significant return on investment in optimizing the customer journey.
2. Where do users most often drop out of the customer journey?
Problem: John, a director of digital marketing, faces a challenge in tracking customer journeys effectively after launching new marketing campaigns. His team's existing marketing analytics tools are great, but provide limited insights.
Traditional analytics give an incomplete picture of the customer journey. They:
- Often focus on traffic and single-page bounce rates (versus showing untapped conversion rate improvement from existing traffic).
- May not be in real-time to make business critical data-driven decisions.
- Unable to uncover friction points in the customer journey costing revenue.
For these reasons, John is left unaware of where exactly customers struggle and drop off during their journey, the business impact of abandonment, and opportunities to increase conversion rates by improving the customer experience without spending more budget on driving new traffic.
Solution: Blue Triangle solves John's problem by providing a comprehensive platform that tracks and visualizes customer paths (both converting and non-converting) on websites and apps in real time.
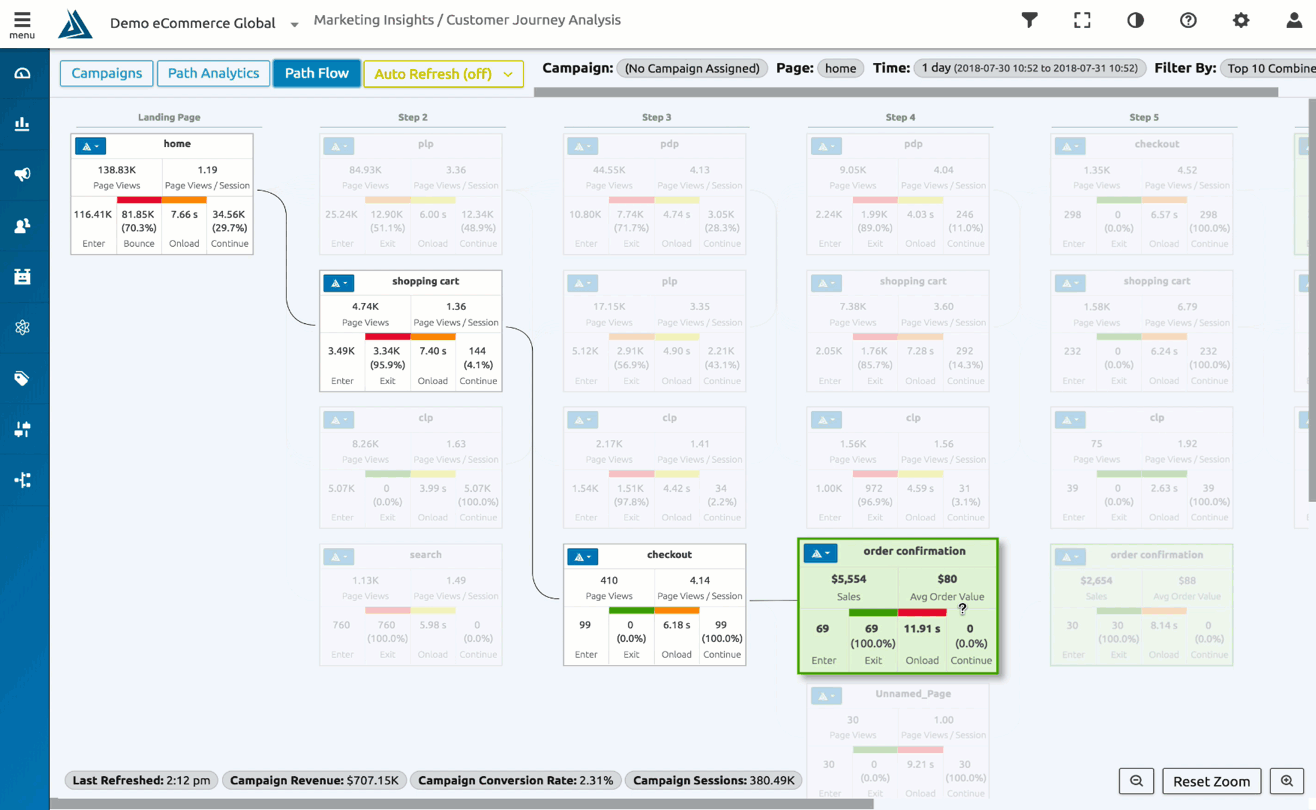
Unlike markeitng anakytics tools like Google Analytics that have a delay in data reporting, Blue Triangle customer journey analytics ensures instant visibility into customer behavior, identifying conversion barriers and friction points.
By leveraging Blue Triangle, John can swiftly optimize campaigns upon launch, gaining valuable customer journey insights, improving conversions, and maximizing revenue without spending more on ads (and against a cookieless advertising landscape).
3. How do we find hidden friction on our site?
Problem: Roger, a director of engineering at a national retailer, faces website performance issues despite efforts by his dev team to optimize page speed and user experience. Hidden, unresolved friction is causing slow pages due to content, third-party tags, and sluggish JavaScript, which is hurting the customer experience.
Solution: Blue Triangle provides prescriptive remediation, offering insights into hidden performance blockers like long-running JavaScript functions. Through function tracing, web film strips, and aggregated performance waterfalls, Blue Triangle empowers Roger to identify friction and prioritize fixes efficiently based on business impact to resolve unseen friction points and enhance the user experience.
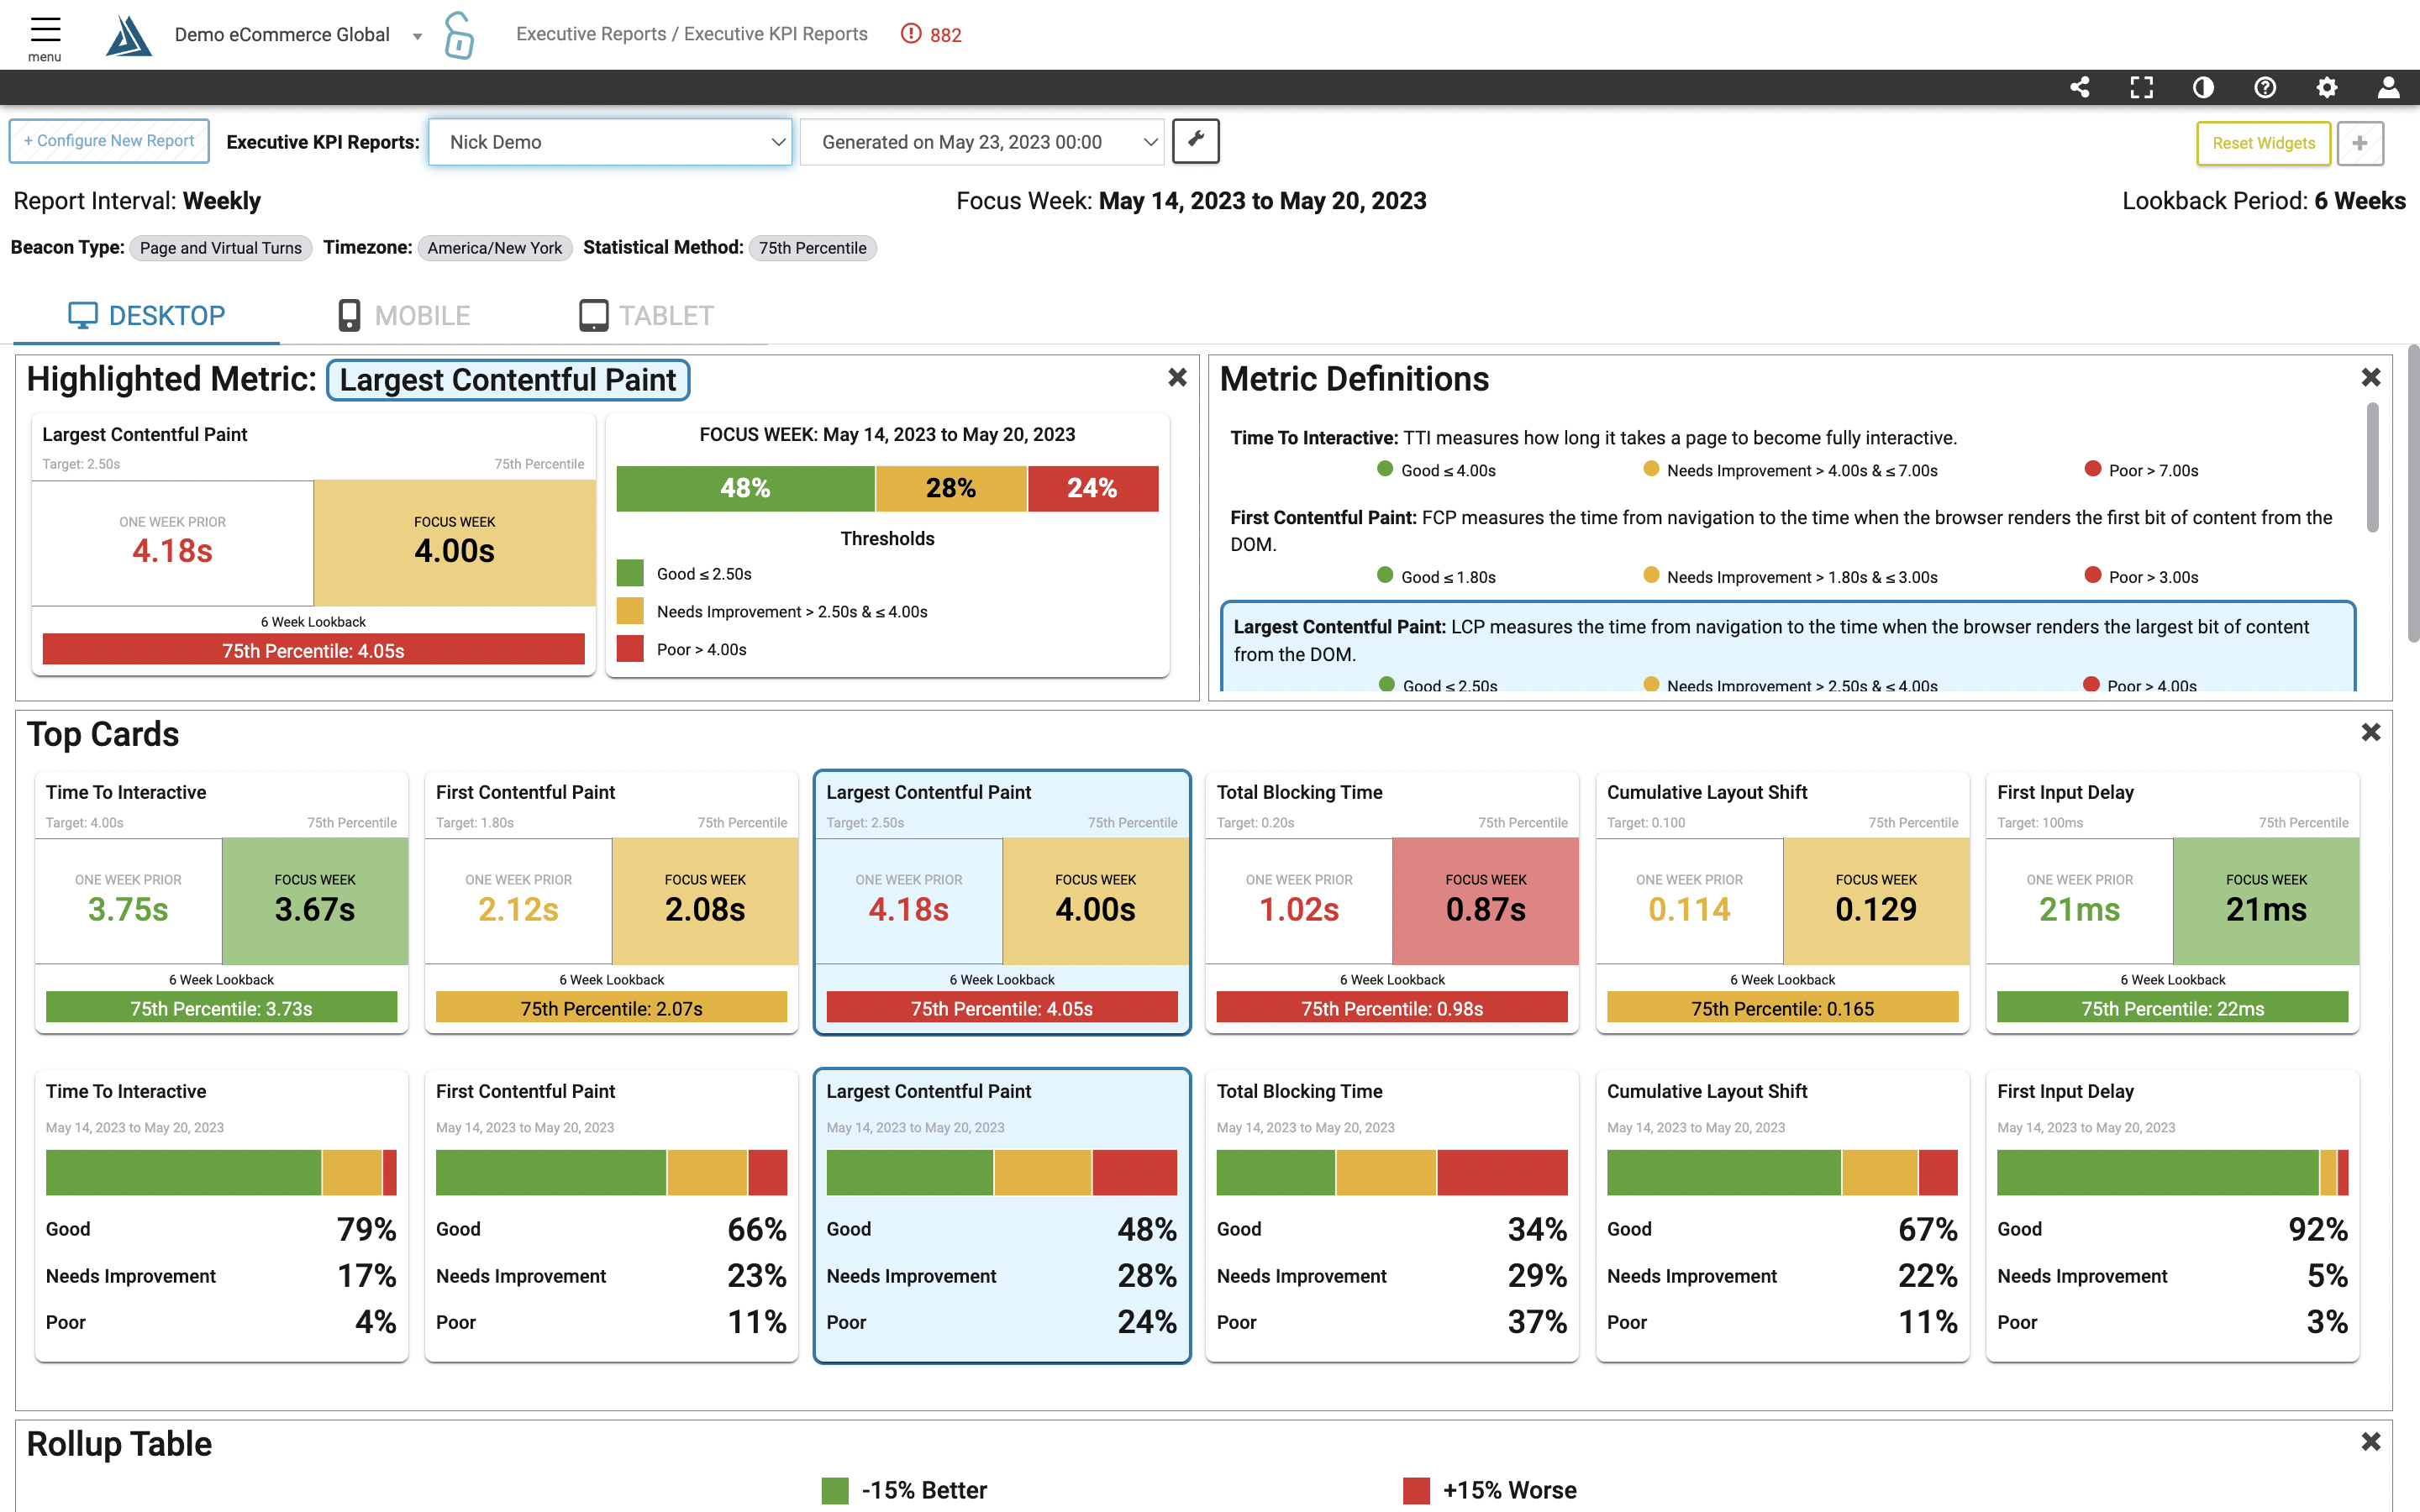
4. What's causing poor Core Web Vital scores?
Problem: Ali, a Marketing VP, is concerned about their Core Web Vitals not improving compared to their competitors despite monitoring them closely. They face challenges in understanding why their scores are dropping and how to improve them for better search outcomes.
Solution: To stay ahead of competitors, Ali can implement real user monitoring to identify issues impacting Core Web Vitals that other tools cannot provide.
Using Blue Triangle VitalScope, they can access real user data aligned with Google's recommendations and a nearly-instant detailed analysis pinpointing score-crushing issues impacting:
- Largest Contentful Paint (LCP)
- Interaction to Next Paint (INP)
- Cumulative Layout Shift (CLS)
With simple red, yellow, and green flags, Ali can quickly identify and address the most damaging issues affecting their scores, enabling them to build a better, frictionless site experience that drives more traffic by improving search ranking.
Interested in learning more about Core Web Vitals?
Watch an on-demand webinar co-presented with Google on Core Web Vitals.
5. How much revenue did we recapture from resolving friction?
Problem: Chief Technology Officer Tom is concerned about the investment needed to remove friction in digital experiences and questions how to validate the business outcomes and ROI from this expense.
Ultimately, he wants to know what's the business case for user experience optimization projects?
This is where traditional observability platforms fall short:
- They're more of an engineering tool instead of a business-outcomes tool.
- While they can provide data on page speed, they're disconnected from conversion and revenue impact.
- They leave you guessing about the ROI of optimization efforts.
Investing time and resources in addressing every blinking red light alerting you of friction isn't practical.
You need to know which friction points to focus on that will yield the greatest returns.
Solution: Blue Triangle quantifies the conversion and revenue losses attributed to friction. And by utilizing real user data to measure the conversions and revenue regained after resolving friction, teams can demonstrate the impact of their efforts.
This evidence-based approach replaces guesswork with concrete proof, allowing teams to present clear-cut revenue attribution reports to the CEO and board, showcasing the tangible ROI of frictionless experiences and justifying digital experience investments.
In fact, our clients produce an average 13.4x ROI from resolving friction with our platform.
Frictionless experience is an investment worth making and an integral part of building customer trust and loyalty. Yet, few brands truly understand how much friction is actually costing in loss of conversions, revenue, trust, and loyalty.
Eat Your Competitors' Lunch
While brands are wasting media spend driving traffic that doesn't convert due to unresolved friction, their current digital experience is like a revenue-leaking bucket. Brands that can put a stop to conversion and revenue leakage will not only survive but thrive and eat their competitors' lunch over time.
You need a solution that:
- Works with your existing tools to uncover hidden friction robbing you of conversions and revenue.
- Unites all teams around delivering frictionless, optimized digital experiences.
- Starts with quantifying friction to answer questions that other tools cannot.
Ready to quantify the shocking conversion impact of friction on your site?
