Black Friday 2021: The Fastest and Slowest Retail Websites
Black Friday spending last year reached a record $9 billion. Online spending has not slowed down even amid economic uncertainty. This year, however, according to a CNBC article, sales rang in slightly lower than 2020. With $8.9 billion in sales on Black Friday, it marks the first time ever that growth has reversed from the prior year.
As for Cyber Monday, initial projections suggest a decline in growth from the prior year, with estimates ranging between $10.2 billion to $11.3 billion according to an article from Fidelity. Stay tuned for our Cyber Monday reporting and analysis!
There has been an ongoing shift to online shopping on Black Friday, compared to packed stores and lines out the door which were common prior to the pandemic. This additional and growing reliance on digital sales places a greater need for reliable site availability and performance.
Methodology
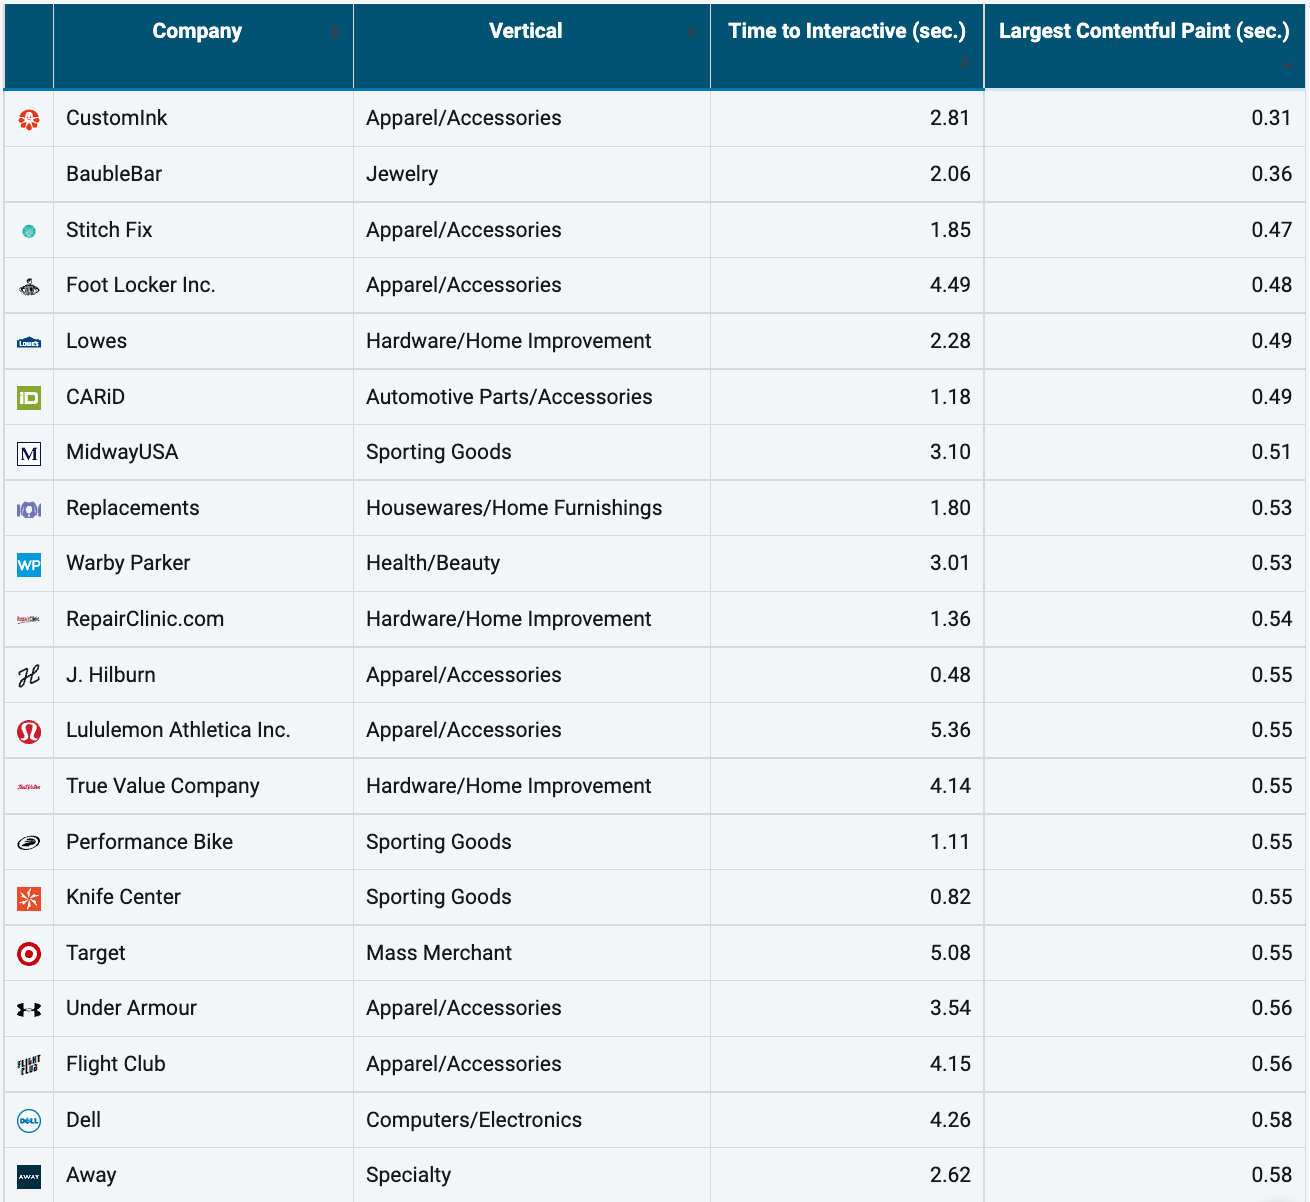
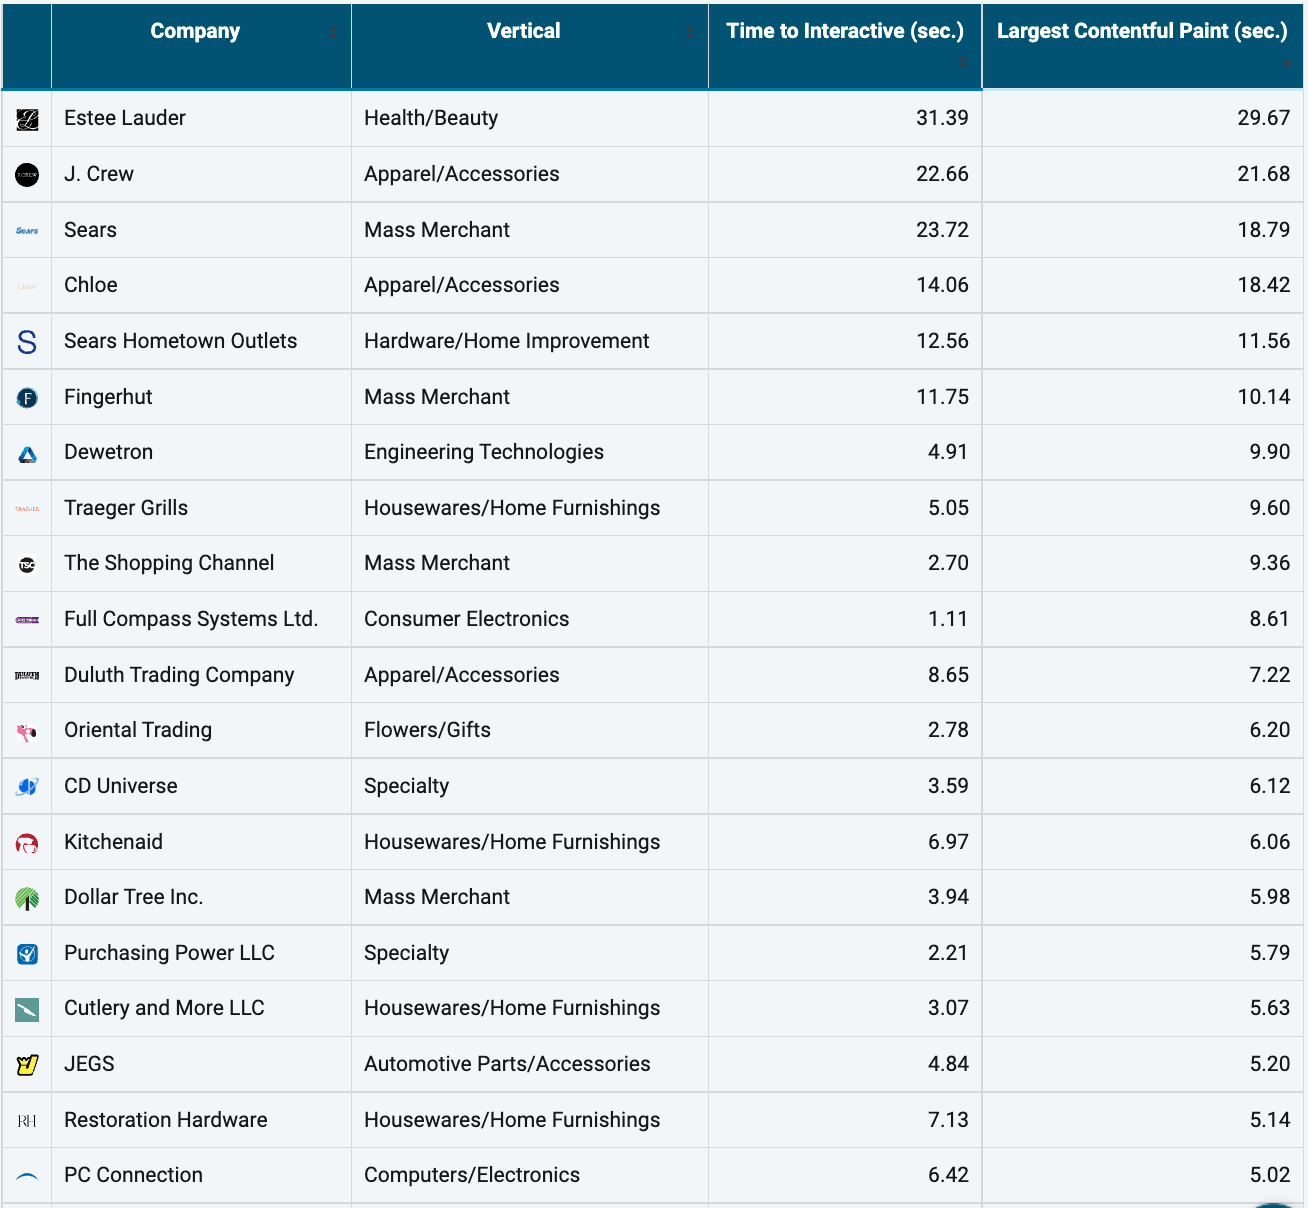
This year we are focusing on two critical web performance indicators – Largest Contenful Paint (LCP), and secondarily, Time to Interactive.
Largest Contentful Paint is a Core Web Vital that measures the time a website takes to show the user the largest content on the screen, complete and ready for interaction. According to Google’s Core Web Vitals Team, an LCP of 2.5 seconds or faster is considered good. An LCP of 4.0 seconds or more is considered bad and needs improvement.
Read more how web vitals impact your online business.
Time to Interactive is the amount of time it takes for the web page to become fully interactive. This is a Google Lighthouse metric and is weighted heavily in Google’s Page Speed Score calculation.
The below report is based on Home Page measurements run by Blue Triangle's Synthetic Monitoring, taken from 5 US locations.
The 20 Fastest US Retail Websites
The 20 Fastest US Retail Websites by Largest Contentful Paint (LCP)

The 20 Slowest US Retail Websites
The 20 Slowest US Retail Websites by Largest Contentful Paint (LCP)
Most online retailers typically experience an increase in website traffic during Cyber Week. So, while these are the 20 slowest US retail websites by Largest Contentful Paint, they may perform differently at normal levels throughout the year.

Key Takeaways
- In-store traffic was up 47.5% compared to 2020, however, was still down 28.3% compared to 2019 pre-pandemic levels
- For the first time ever, spending online during Black Friday fell from the previous year ($8.9 billion compared to $9 billion in 2020)
Interested in seeing how the top US retailers stack up weekly? Check out our Retail US Benchmarks.

During the holiday rush, every shopper matters
Optimize the customer journey before the eCommerce event of the year.

.jpg)

