Black Friday 2022: The Fastest and Slowest Retail Websites
Black Friday 2022 online sales are projected to grow by just 1% year-over-year at $9 billion, according to early estimates from Adobe. With $8.9 billion in sales the year before, Black Friday 2021 marked the first time growth reversed. Can online sales buck the trend this year?
The results are in – let’s take a look!
According to reporting from CNBC, consumers spent a record $9.12 billion online during Black Friday this year, up 2.3% year-over-year. Grappling with high prices and inflation, many consumers embraced flexible payment options, such as Buy Now Pay Later, to purchase popular items including electronics, toys, and exercise equipment.
Similiar to Thanksgiving Day 2022, 48% of online sales were made on mobile devices, up from last year and setting a new record for Black Friday mobile orders. Consumers demand the same frictionless experience on mobile as they receive from desktop to transact any where, any time.
Methodology
This Cyber Week, we are focusing on two critical web performance and user experience indicators – Largest Contentful Paint (LCP) and, secondarily, Time to Interactive.
Largest Contentful Paint is a Core Web Vital that measures the time a website takes to show the user the largest content on the screen, complete and ready for interaction. This helps give you an idea of how quickly the page renders the most important content for the user and the point at which they will start interacting with the page.
According to Google’s Core Web Vitals Team, an LCP of 2.5 seconds or faster is considered good. An LCP between 2.5 and 4.0 seconds needs improvement, and greater than 4.0 seconds is considered poor.
Why does LCP matter? Read more about how LCP correlates to business outcomes.
Time to Interactive (TTI) is the amount of time it takes for the web page to become fully interactive. It helps identify situations where a page may look ready for interaction but isn’t, thus creating a frustrating user experience. According to Google Lighthouse, a Time to Interactive of 0-3.8 seconds is fast, 3.9-7.3 seconds is moderate, and over 7.3 seconds is slow.
The below report is based on Home Page measurements collected by Blue Triangle Synthetic Monitoring, taken from 5 U.S. locations.
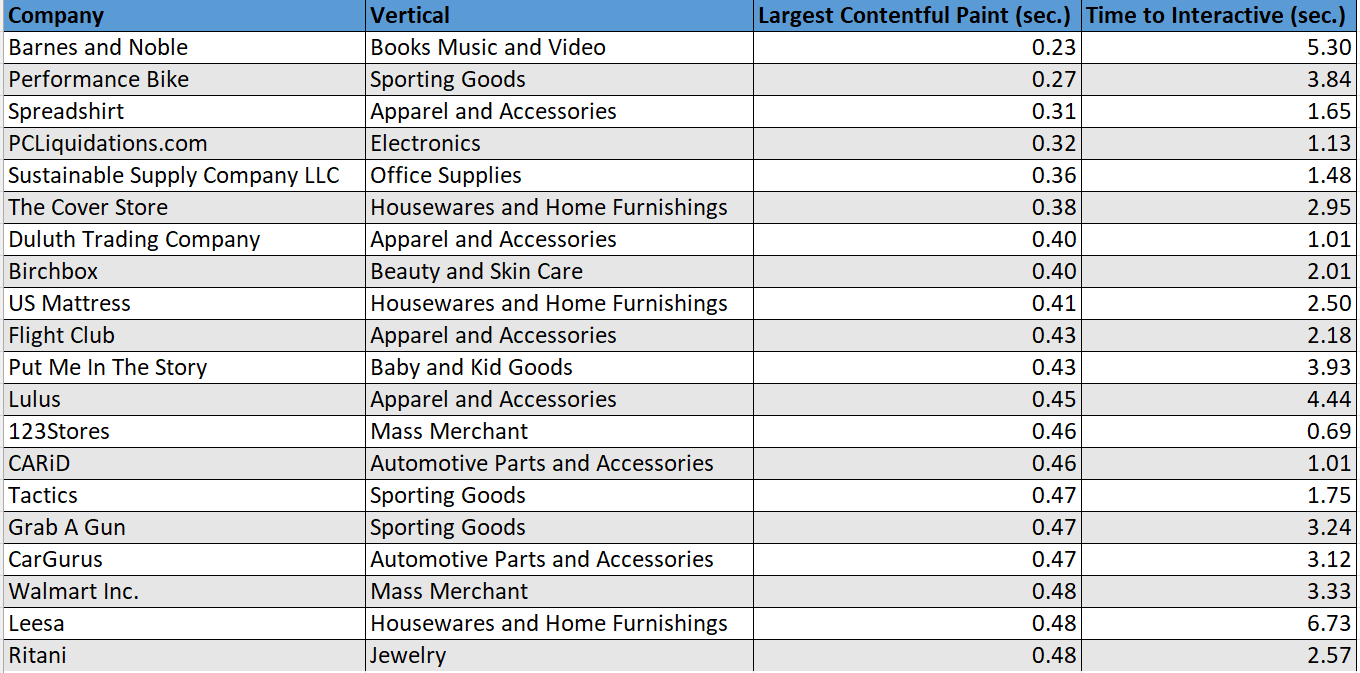
The 20 Fastest Retail Websites
The 20 Fastest Retail Websites by Largest Contentful Paint (LCP)

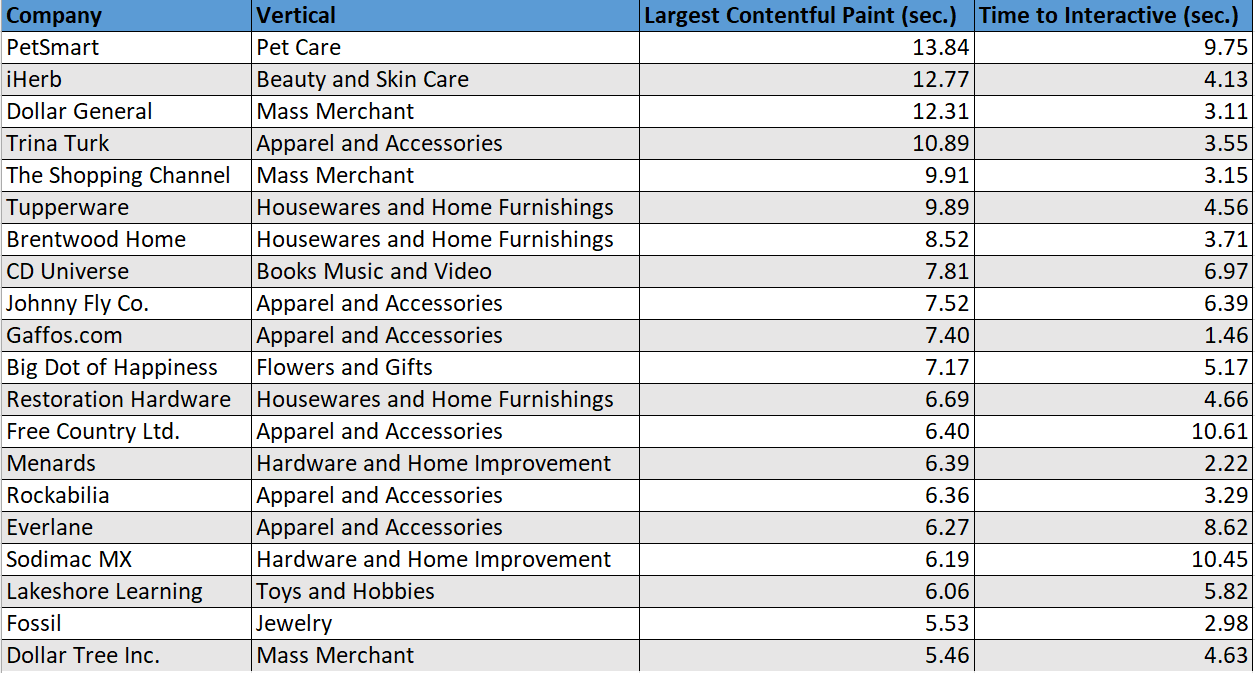
The 20 Slowest Retail Websites
The 20 Slowest Retail Websites by Largest Contentful Paint (LCP)
Key Takeaways
- Shoppers and retailers weathered the economic storm, with U.S. consumers spending a record $9.12 billion online on Black Friday 2022. This figure surpassed earlier estimates!
- Consumers turned to smartphones to make their Black Friday 2022 holiday purchases, with data showing that mobile shopping represented 48% of all digital sales on Black Friday. Mobile traffic is increasingly taking a larger share from desktop and growing fast. Retailers and eCommerce websites must understand and prepare for this shift in consumer preferences.
- During the busy online shopping season, even big websites have outages and crashes due to poor website performance. Outages are expensive, both in terms of lost customers and revenue, and also brand image. At Blue Triangle, we qunatify the cost of friction on your website and help you resolve those friction points to get ready for your next big sales rush.

During the holiday rush, every shopper matters
Optimize the customer journey before the eCommerce event of the year.

.jpg)


