Identifying patterns in data can help businesses plan more effective website strategies. Many companies are adding Data Scientists to guide those decisions, such as identifying the impact page speed has on conversions, sales and revenue. Blue Triangle's core focus is helping data scientists and other business leads find the relationship in the data between page speed impact and your website's customers.
When we talk to companies, frequently their data scientist will chime into the conversation and announce, "We build all our own tools" or "I have tools, big data structures, and can develop what you do". The dilemma between working with our analysis tools and "growing your own" all comes down to a business decision: if the effort saves the company time and money, then it's a no-brainer to build some things yourself. But for a solution that could take months to build and test, and requires an understanding of domain and industry context, then you should consider three things:
- The cost to build and maintain versus the cost of a commercially-available SaaS solution
- The time to business benefit
- The quality and accuracy of your solution versus a refined and tested SaaS solution
Your decision should center around the best ways to maximize valuable time and resources – leveraging existing technologies when economically feasible.
Blue Triangle provides actionable data with clear visualizations designed for the many different roles in your organization—management, development support and market analysis. Blue Triangle's tools, charts and reports present the story of the data so you don't have to spend hours every week gathering, analyzing, and explaining that data to the different parts of your company's organization. Our goal to help you present clear and critical information about your websites in an effective, concise way to convince your business owners and technology leads to take appropriate action.
When Blue Triangle initially talked to Microsoft.com, they told us that they had spent several months trying to put their datasets into a consumable reporting format in order to do the exact reporting that we provide as an easy-to-implement SaaS solution.
Cost to Build and Maintain
After building Blue Triangle's business and technical analysis portal, let me share some of the process of building a complex data analysis solution. We spent four years building a solution that continuously receives web experience data from every page of a user's web visit, and correlating page speeds to the decision to buy. We present these results in a portal for on-demand consumption at the business level or the data science level.
We spent a lot of time working on the algorithms to get reliable results from site to site. The first cut of our solution was nowhere near as accurate as the one we have today – and took six months to get predictive results that were anywhere near as accurate.
Getting correlation was one thing; figuring out how to provide businesses revenue predictions for speeding up a website by one second was another. Connecting revenue to web performance meant we had to get to causation first. We had to look at numerous sites, build and test our algorithms so we could be accurate when our solution showed a business how they could get another million dollars a month by speeding up specific pages of their site.
Blue Triangle has been perfecting this process for four years now. We can give recommendations about page response times and accurately predict improved revenue when site owners address the speed of their website's pages. Today, we can give relatively accurate revenue projections with plus or minus 15% accuracy.
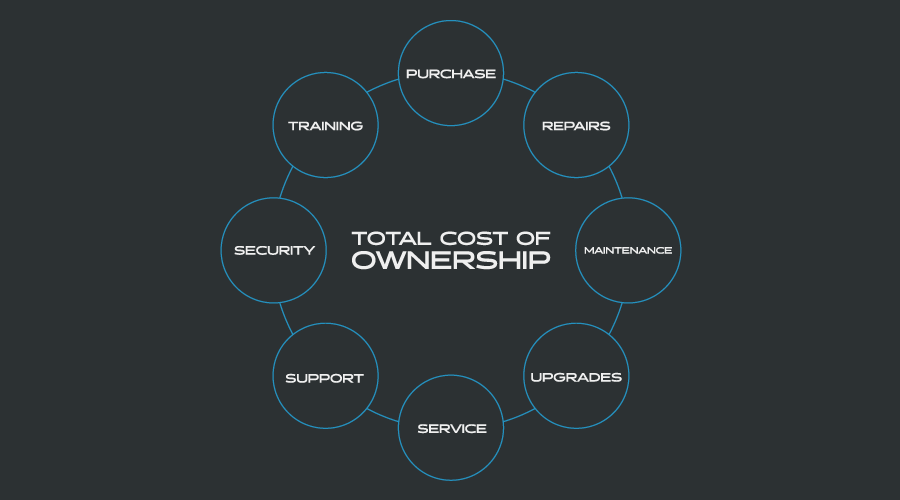
The cost to build includes the following:
- Multiple developers
- A large data repository
- Develop and test cost-effective cloud resources needed to collect data from every web page without slowing down that page
- Develop and build resources to process, categorize and correlate the data as it comes in real-time and ad-hoc analysis of the data
- Automating reports sent to consumers of the data
If you want to build a system that does all of the above, it could cost you six months to a year to get good results, and easily $500,000 to $1,000,000 in research, development, infrastructure and of course time–your most valuable resource of all.
Next, consider the ongoing cost of maintaining this system. You can't build a system and not have any more development and test phases. Consider also the infrastructure costs necessary to collect data on the scale of Cyber Monday loads, maintaining a stable uptime, and scale on demand all year long.
Don't forget the costs of maintenance and support by dedicated IT professionals. For the number of technical personnel providing research, development and technical support to process the amount of data for a large ecommerce site, we estimate between $100K to $350K per year to maintain these systems, respond to outages, etc.
Quality and Accuracy Vs. a Commercially Available SaaS Solution
Blue Triangle's SaaS solution is proven: we've analyzed numerous sites and our expertise brings a great deal of industry context to the table. If you try to “grow your own” data solution in-house, you could be constantly second-guessing your results. You can avoid this pitfall by selecting a SaaS solution like Blue Triangle's that has taken the time to determine accurate revenue prediction for a recommended one or two second speed improvement through analysis of hundreds of websites.
Time to Business Benefit
We were engaged with a very large online electronics retailer and found page speeds were having a massive impact on customer buying patterns. We gave some very focused recommendations, which they implemented. In short, our solution identified a handful of pages they needed to speed up by about 35% in order to get a tremendous improvement in sales. Those pages were basically slow enough that a significant portion of their site's visitors were abandoning the site before checkout. The company implemented those changes and saw a dramatic increase in sales directly attributed to the increase in page speeds (using their own data; not witchcraft). This company increased revenues by roughly $20,000,000 per month – directly attributed to the changes in page speed we discovered and they implemented.
Let's return to the scenario where this customer builds the analytics solution themselves. Let's also assume they can build an effective solution with halfway reliable predictive results in six months. A time delay of six months would have brought about a loss of $120,000,000 in revenue--all because of that delay. Again, time is the most important asset.
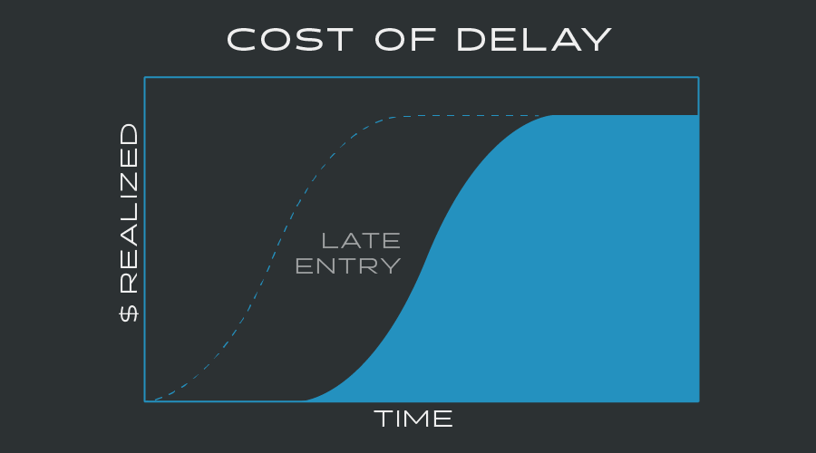
As another example, what if the process takes nine months? That's $180,000,000 less online sales for your site.
Conclusion
Before undertaking a large-scale project to examine your website's performance, it's important to discuss all risks and elements. Do the benefits of buying a robust, tested SaaS platform outweigh the time and development costs of building your own in-house website performance analysis system? Be prepared to conduct cost-benefit analyses and get buy-in from the business stakeholders.
Learn more about the advantages of using Blue Triangle's proven tools and expertise to quantify the impact of website performance.
During the holiday rush, every shopper matters
Optimize the customer journey before the eCommerce event of the year.

.jpg)
