.svg)
Explaining complex concepts without delving into a tedious sales pitch often requires a touch of creativity and relatability, all components of telling a compelling narrative.
Storytelling was the secret formula behind Steve Jobs' legendary presentations. And it's often a question I ask myself before giving a presentation, "How would Steve approach this?" to turn a pitch into a thrill ride.
Recently, during a conversation with a prospective client, the challenge arose of explaining how Blue Triangle quantifies user and employee friction without resorting to a traditional sales spiel.
The solution? A surprising pivot to the world of Formula 1 (F1) racing.
Rather than diving straight into technical jargon, I initiated a conversation by asking the prospect if they enjoyed watching Formula 1 races. Luckily, they did, and this served as the perfect segue into describing Blue Triangle.
I brought up the Drag Reduction System (DRS) used in F1 cars and asked why they thought the concept came about.
The immediate response was, "To make the cars faster than their competition!"
However, I further probed why they aimed to surpass their competitors.
The answer? He said, "To earn the most points in the F1 series for the year. You not only get more prize money but also more sponsors to help pay for expenses for next year and R&D to make the car even faster."
Perfecting your F1 Car and frictionless experiences with Continuous Experience Optimization.

The ultimate business outcome in F1 racing is to secure the highest points for more funding to fuel future advancements and continuously improve performance and race results.
To achieve this outcome, that's where DRS comes into play. In short, it reduces drag on the car for better gas efficiency and less weight to maximize speed when they need it the most.
Similarly, companies strive to achieve specific outcomes – more sales and revenue, higher conversion rates, improved customer experiences, and all the benefits of delivering a frictionless experience.
The key question emerges: how do businesses achieve these critical outcomes?
Just as DRS in F1 optimizes car performance, Blue Triangle empowers companies to meaningfully optimize the customer experience for better business outcomes.
By reducing friction on websites and mobile apps, much like reducing drag on an F1 car, we help you create frictionless user experiences that create customer trust and loyalty, which drives higher conversion rates and revenue.
Like racing cars, milliseconds make millions.
 Can milliseconds really cost you millions?
Yes! And there's research that confirms friction results in revenue loss.
Bringing it back to "friction quantified," I told this prospective customer how our revenue conversion rate curve can quantify the business outcome they want to achieve. In this case, being in the financial services industry, the goal was to get more people to complete the credit card application on their website.
They know that every person who completes an application equates to a specific dollar figure to the company each year. For illustrative purposes, let's say that amount is $100/year per person on average who applies.
Tired of seeing your consumers – and revenue – drift off?
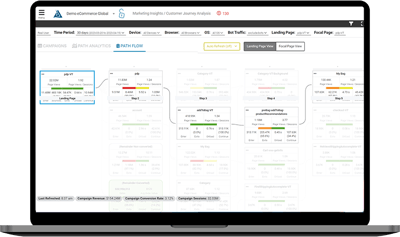 We then show the user journey as people move through the website looking to apply for a credit card. Visualizing the customer journey, we identify where users abandon the process due to costly site friction, such as broken links, unoptimized JavaScript and tags, and revenue-robbing page elements contributing to a suboptimal user experience.
Through meticulous analysis, we showcase that even minor improvements in page loading times can result in a higher percentage of users completing credit card applications.
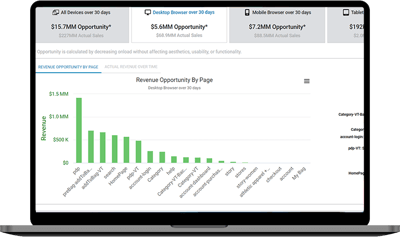 Our revenue opportunity calculator demonstrates how specific improvements (such as improving the user experience by 0.25 seconds, 0.5, 1.0, etc.) lead to increased conversions and revenue.
Once we've prioritized which friction points to resolve, we show them what they can change on their site to achieve these business outcomes-based results. After making changes, we validate business outcomes to prove and continuously improve your ROI, which CEOs and CFOs care about, especially in this economy.
By presenting real-time data and concrete examples, we empower businesses to prioritize efforts effectively and make informed decisions to fix what matters most and maximize ROI.
Quantifying user friction goes beyond mere insights; it guides businesses from guesswork to data-driven decisions. It transcends finger-pointing by pinpointing the exact areas in the user journey where friction is costing you not only money but lost customer loyalty, allowing for precise remediation to convert more users and capture more revenue.
Effective storytelling in sales and business can drive better results.
Happy to say that we're now moving forward with the next steps for this person to evaluate Blue Triangle's Continuous Experience Optimization platform.
So, my lesson here is that by asking a few questions and finding a way to equate your "sales pitch" to something a prospect is interested in, you not only help the message resonate, but it'll be more memorable than just another pitch deck.
This approach doesn't just sell a product; it builds relationships and trust. And in the world of business and life, that's the ultimate victory lap.